Air Resources Laboratory banner image
Air Resources Laboratory web site National Oceanic and Atmospheric Administration (NOAA)
Gridded Forecast Meteorological Data READY logo

Many of the HYSPLIT-compatible forecast data files are available directly from NOAA NCEP on a server called NOMADS (NOAA Operational Model Archive and Distribution System) . NOMADS is located at: https://nomads.ncep.noaa.gov/

We also have these data sets on our ftp server, ftp.arl.noaa.gov, in the /forecast directory. The ftp server may be accessed by a ftp client or by a web browser. 1) If you want to use a ftp client, Windows PC users may use WinSCP, FileZilla, etc. that support passive mode. MacOS and Linux users may use the ftp command. Connect your ftp client to ftp.arl.noaa.gov using anonymous and your email address for the username and password, respectively. Note if you are using multiple ftp connections, limit the number of concurrent connections equal to or less than two. Otherwise, your access to our ftp server may be blocked off. 2) If you are using a web browser, point it to https://www.ready.noaa.gov/data/forecast.


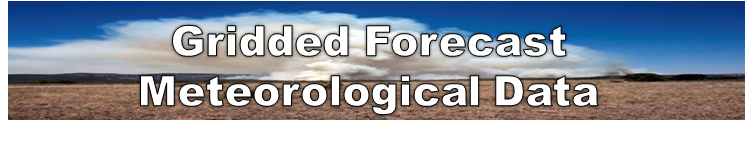
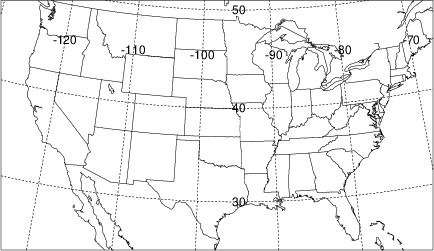
HRRR 3 km (pressure)

The High Resolution Rapid Refresh (HRRR) model contains pressure level forecast data every hour from forecast hours 0 to 18 on a 3 km 1799 x 1059 grid covering the United States and Southern Canada. Domain map of HRRR 3 km.

  • SURFACE FIELDS:
    • SHGT PRSS MSLP TPP1 DIFR T02M DP2M PBLH DSWF ULWF U10M V10M VSBY CSNO CICE CFZR CRAI LIB4 CAPE CINH TCLD REFC CLDB CLDT LTNG PRAT LISD
  • UPPER-LEVEL FIELDS:
    • (1013 1000 975 950 925 900 875 850 825 800 775 750 725 700 675 650 625 600 575 550 525 500 475 450 425 400 375 350 325 300 275 250 225 200 175 150 125 100 75 50)
    • TEMP UWND VWND WWND DIFW RELH HGTS
  • Filename on FTP servers:
    • hysplit.tXXz.hrrrpf, where XX is the cycle (00, 03, 06, 09, 12, 15, 18, 21)
More Information | NCEP HRRR Products | NCEP Model Analysis and Forecasts

HRRR 3 km (sigma)

The High Resolution Rapid Refresh (HRRR) model contains sigma level forecast data every hour from forecast hours 0 to 18 on a 3 km 1799 x 1059 grid covering the United States and Southern Canada. At forecast hour 0, the data are a 1-hour forecast from the previous cycle. Domain map of HRRR 3 km.

  • SURFACE FIELDS:
    • SHGT MSLP TPP1 DIFR T02M RH2M U10M V10M PRSS LHTF SHTF USTR RGHS DSWF PBLH TCLD REFC CAPE
  • UPPER-LEVEL FIELDS:
    • (1.0 0.9990 0.9960 0.9905 0.9810 0.9670 0.9490 0.9275 0.9040 0.8785 0.8500 0.8185 0.7840 0.7465 0.7060 0.6625 0.6160 0.5670 0.5195 0.4767 0.4385 0.4041 0.3729 0.3449 0.3198 0.2767 0.2412 0.2118 0.1836 0.1553 0.1271 0.0989 0.0718 0.0527 0.0304 0.0124)
    • TEMP UWND VWND WWND DIFW SPHU TKEN PRES
  • Filenames on FTP servers:
    • hysplit.tXXz.hrrrf, where XX is the cycle (all hours, large data set)
    • hysplit.tXXz.hrrrf00, where XX is the cycle (hours 0 to +5)
    • hysplit.tXXz.hrrrf06, where XX is the cycle (hours +6 to +11)
    • hysplit.tXXz.hrrrf12, where XX is the cycle (hours +12 to +17)
    • hysplit.tXXz.hrrrf18, where XX is the cycle (hour +18)
More Information | NCEP HRRR Products | NCEP Model Analysis and Forecasts

NAM 3 km CONUS Nest (sigma-pressure hybrid)

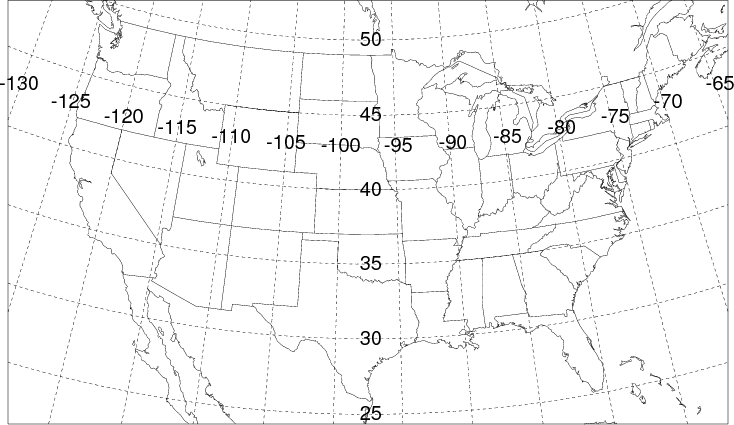
The NAM model 3 km CONUS nest contains pressure-sigma hybrid level forecast data every hour from forecast hours 0 to 48 on a 3 km 1792 x 1059 grid covering the United States. There are eight files per cycle with each one containing 6 hours of forecast data.
Domain map of NAM CONUS Nest.

  • SURFACE FIELDS:
    • SHGT MSLP TPP3 T02M SOLM RH2M U10M V10M PRSS LHTF SHTF USTR RGHS DSWF PBLH TCLD LCLD MCLD HCLD
  • UPPER-LEVEL FIELDS: Note, these levels are pressure-sigma hybrid levels. The pressure level is defined as:

    P = A + B*PRSS,

    where PRSS is the surface pressure and A.B is defined as the level (ie., 16.9640 = 980 hPa when the surface pressure is 1000 hPa)
    • (1.0000 6.9883 10.9800 13.9720 16.9640 20.9560 24.9480 27.9390 31.9300 35.9210 39.9110 44.9020 48.8910 53.8800 58.8690 63.8570 69.8430 76.8270 83.8080 92.7870 103.7600 127.7100 157.6300 192.5500 231.4500 269.3600 307.2600 339.1600 361.0800 357.0200 315.0000 261.0000 217.0000 180.0000 149.0000 121.0000 94.0000 69.0000 44.0000 19.0000)
    • TEMP UWND VWND WWND SPHU TKEN
  • Filenames on FTP servers:
    • hysplit.tXXz.namsf00.CONUS, where XX is the cycle, contains hours 1 to 6
    • hysplit.tXXz.namsf06.CONUS, where XX is the cycle, contains hours 7 to 12
    • hysplit.tXXz.namsf12.CONUS, where XX is the cycle, contains hours 13 to 18
    • hysplit.tXXz.namsf18.CONUS, where XX is the cycle, contains hours 19 to 24
    • hysplit.tXXz.namsf24.CONUS, where XX is the cycle, contains hours 25 to 30
    • hysplit.tXXz.namsf30.CONUS, where XX is the cycle, contains hours 31 to 36
    • hysplit.tXXz.namsf36.CONUS, where XX is the cycle, contains hours 37 to 42
    • hysplit.tXXz.namsf42.CONUS, where XX is the cycle, contains hours 43 to 48
More Information | NCEP Mesoscale Branch | NCEP Model Analysis and Forecasts

NAM 12 km (sigma-pressure hybrid)

The NAM model contain pressure-sigma hybrid level forecast data every hour from forecast hours 0 to 48 on a 12 km 461 x 401 grid covering the continental United States.

  • SURFACE FIELDS:
    • SHGT MSLP TPP3 T02M SOLM RH2M U10M V10M PRSS LHTF SHTF USTR RGHS DSWF PBLH TCLD LCLD MCLD HCLD
  • UPPER-LEVEL FIELDS: Note, these levels are pressure-sigma hybrid levels. The pressure level is defined as:

    P = A + B*PRSS,

    where PRSS is the surface pressure and A.B is defined as the level (ie., 16.9640 = 980 hPa when the surface pressure is 1000 hPa)
    • (1.0000 6.9883 10.9800 13.9720 16.9640 20.9560 24.9480 27.9390 31.9300 35.9210 39.9110 44.9020 48.8910 53.8800 58.8690 63.8570 69.8430 76.8270 83.8080 92.7870 103.7600 127.7100 157.6300 192.5500 231.4500 269.3600 307.2600 339.1600 361.0800 357.0200 315.0000 261.0000 217.0000 180.0000 149.0000 121.0000 94.0000 69.0000 44.0000 19.0000)
    • TEMP UWND VWND WWND SPHU TKEN PRES
  • Filenames on FTP servers:
    HYSPLIT.tXXz.namsf, where XX is the cycle
More Information | NCEP Mesoscale Branch | NCEP Model Analysis and Forecasts

NAM 12 km (pressure)

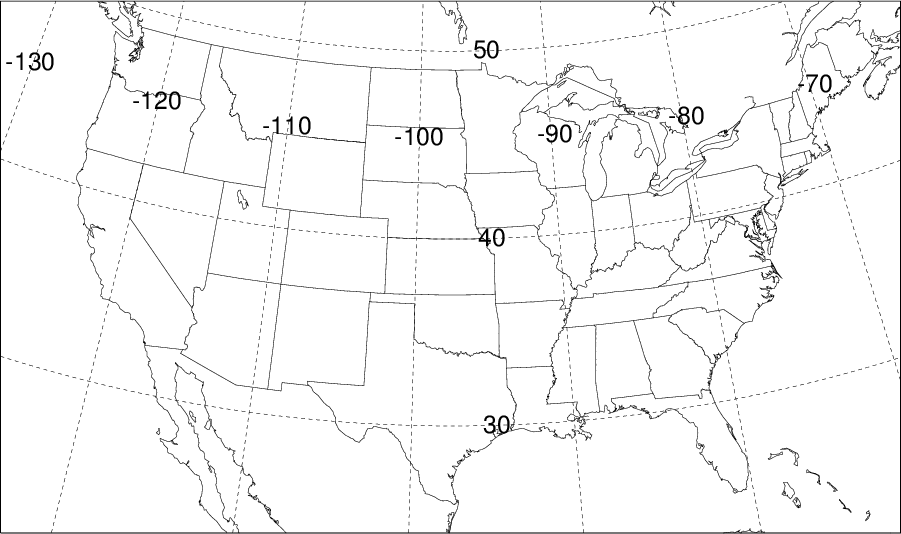
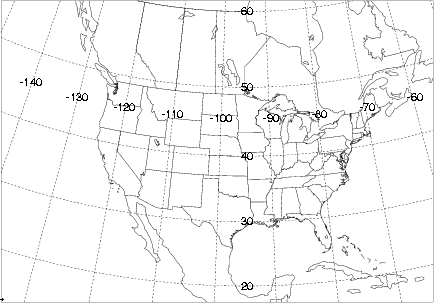
The NAM model contains pressure level forecast data every 3 hours from forecast hours 0 to 84 on a 12 km 614 x 428 grid covering the United States and Southern Canada. Domain map of NAM 12 km.

  • SURFACE FIELDS:
    • MSLP TPP3 CPP3 T02M RH2M U10M V10M PRSS LHTF SHTF USTR RGHS DSWF TMPS SOLT SOLW WESD CSNO CICE CFZR CFRAI VSBY TCLD CAPE CINH LISD LIB4 SHGT
  • UPPER-LEVEL FIELDS:
    • (1000 975 950 925 900 875 850 825 800 775 750 725 700 650 600 550 500 450 400 350 300 250 200 150 100 50)
    • UWND VWND HGTS TEMP WWND RELH TKEN
  • Filenames on FTP servers:
    • hysplit.tXXz.namf, where XX is the cycle
More Information | NCEP Mesoscale Branch | NCEP Model Analysis and Forecasts

NAM 1 km Fire Weather Nest (sigma-pressure hybrid)

The NAM model 1 km nest for fire weather events contain pressure-sigma hybrid level forecast data every hour from forecast hours 0 to 36 on a 1 km 356 x 356 grid that can vary with each model run.
Current NAM Fire Weather Domains.

  • SURFACE FIELDS:
    • SHGT MSLP TPP1 T02M SOLM RH2M U10M V10M PRSS LHTF SHTF USTR RGHS DSWF PBLH TCLD LCLD MCLD HCLD
  • UPPER-LEVEL FIELDS: Note, these levels are pressure-sigma hybrid levels. The pressure level is defined as:

    P = A + B*PRSS,

    where PRSS is the surface pressure and A.B is defined as the level (ie., 16.9640 = 980 hPa when the surface pressure is 1000 hPa)
    • (1.0000 6.9883 10.9800 13.9720 16.9640 20.9560 24.9480 27.9390 31.9300 35.9210 39.9110 44.9020 48.8910 53.8800 58.8690 63.8570 69.8430 76.8270 83.8080 92.7870 103.7600 127.7100 157.6300 192.5500 231.4500 269.3600 307.2600 339.1600 361.0800 357.0200 315.0000 261.0000 217.0000 180.0000 149.0000 121.0000 94.0000 69.0000 44.0000 19.0000)
    • TEMP UWND VWND WWND SPHU TKEN
  • Filenames on FTP servers:
    • hysplit.tXXz.namsf.FW, where XX is the cycle
More Information | NCEP Mesoscale Branch | NCEP Model Analysis and Forecasts

NAM 2.5 km Hawaii (sigma-pressure hybrid)

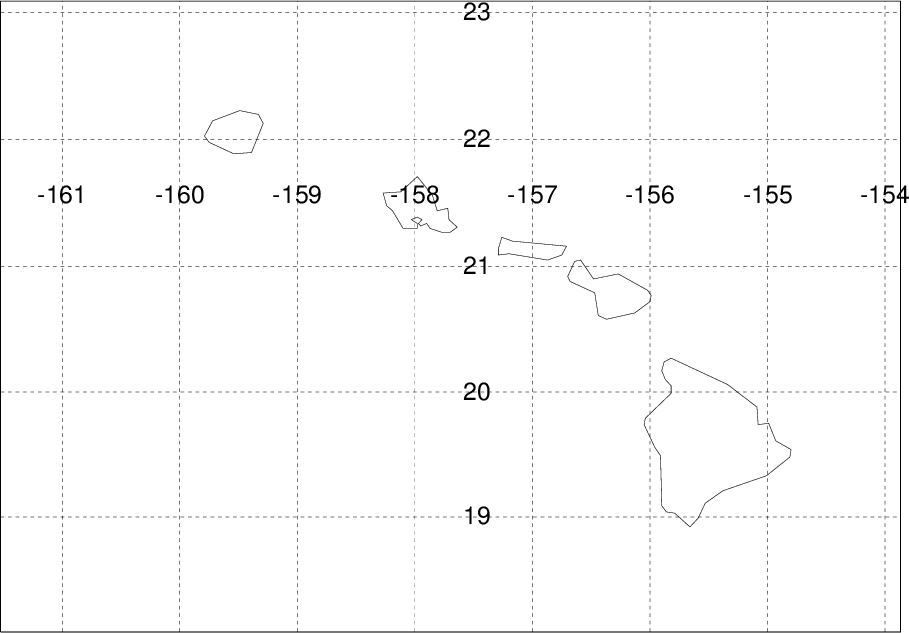
The NAM model Hawaii 2.5 km contain pressure-sigma hybrid level forecast data every hour from forecast hours 0 to 48 on a 2.5 km 321 x 225 grid covering the Hawaii region.
Domain map of NAM 2.5 km Hawaii grid.

  • SURFACE FIELDS:
    • SHGT MSLP TPP3 T02M SOLM RH2M U10M V10M PRSS LHTF SHTF USTR RGHS DSWF PBLH TCLD LCLD MCLD HCLD
  • UPPER-LEVEL FIELDS: Note, these levels are pressure-sigma hybrid levels. The pressure level is defined as:

    P = A + B*PRSS,

    where PRSS is the surface pressure and A.B is defined as the level (ie., 16.9640 = 980 hPa when the surface pressure is 1000 hPa)
    • (1.0000 6.9883 10.9800 13.9720 16.9640 20.9560 24.9480 27.9390 31.9300 35.9210 39.9110 44.9020 48.8910 53.8800 58.8690 63.8570 69.8430 76.8270 83.8080 92.7870 103.7600 127.7100 157.6300 192.5500 231.4500 269.3600 307.2600 339.1600 361.0800 357.0200 315.0000 261.0000 217.0000 180.0000 149.0000 121.0000 94.0000 69.0000 44.0000 19.0000)
    • TEMP UWND VWND WWND SPHU TKEN
  • Filenames on FTP servers:
    • hysplit.tXXz.namsf.HI, where XX is the cycle
More Information | NCEP Mesoscale Branch | NCEP Model Analysis and Forecasts

NAM 12 km Alaska (sigma-pressure hybrid)

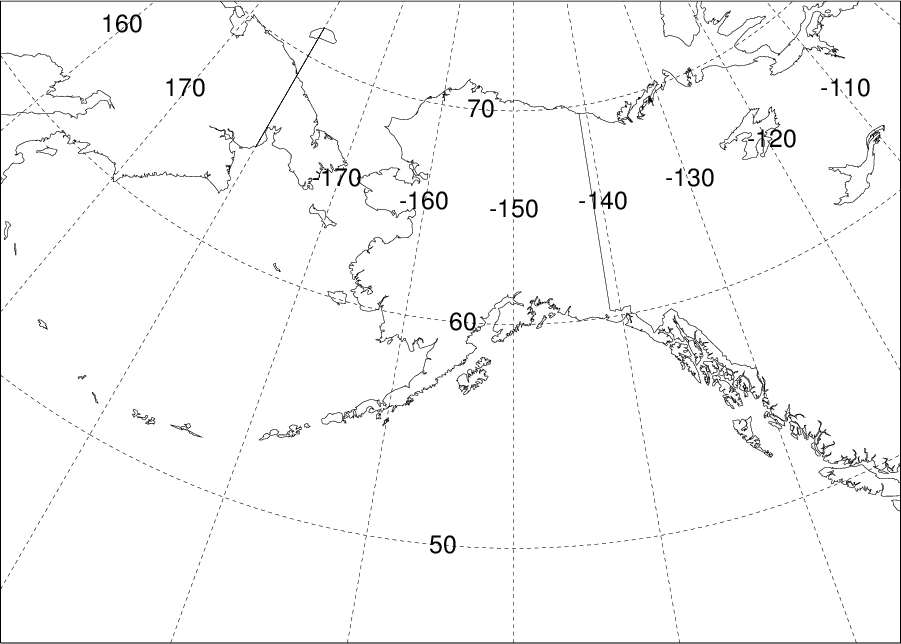
The NAM model Alaska 12 km contain pressure-sigma hybrid level forecast data every hour from forecast hours 0 to 48 on a 12 km 387 x 276 grid covering the Alaska region.
Domain map of NAM 12 km Alaska grid.

  • SURFACE FIELDS:
    • SHGT MSLP TPP3 T02M SOLM RH2M U10M V10M PRSS LHTF SHTF USTR RGHS DSWF PBLH TCLD LCLD MCLD HCLD
  • UPPER-LEVEL FIELDS: Note, these levels are pressure-sigma hybrid levels. The pressure level is defined as:

    P = A + B*PRSS,

    where PRSS is the surface pressure and A.B is defined as the level (ie., 16.9640 = 980 hPa when the surface pressure is 1000 hPa)
    • (1.0000 6.9883 10.9800 13.9720 16.9640 20.9560 24.9480 27.9390 31.9300 35.9210 39.9110 44.9020 48.8910 53.8800 58.8690 63.8570 69.8430 76.8270 83.8080 92.7870 103.7600 127.7100 157.6300 192.5500 231.4500)
    • TEMP UWND VWND WWND SPHU TKEN
  • Filenames on FTP servers:
    • hysplit.tXXz.namsf.AK, where XX is the cycle
More Information | NCEP Mesoscale Branch | NCEP Model Analysis and Forecasts

GFS Model (1 degree, pressure)

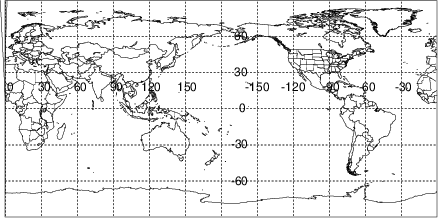
The Global Forecasting System (GFS) one-degree latitude-longitude grid contains forecast data every 3 hours from forecast hours 0 to 240 covering the globe. The model data is updated 4 times per day.

  • SURFACE FIELDS:
    • PRSS MSLP TPP6 UMOF VMOF SHTF DSWF RH2M U10M V10M T02M TCLD SHGT CAPE CINH LISD LIB4 PBLH
  • UPPER-LEVEL FIELDS:
    • (1000 975 950 925 900 850 800 750 700 650 600 550 500 450 400 350 300 250 200 150 100)
    • HGTS TEMP UWND VWND RELH WWND
    • (50)
    • HGTS TEMP UWND VWND RELH
    • (20)
    • HGTS TEMP UWND VWND
  • Filenames on FTP servers:
    • hysplit.tXXz.gfsf, where XX is the cycle
More Information | NCEP Model Analysis and Forecasts

GFS (Long Range) Model

The Global Forecasting System or GFSlr (we sometimes denote this very long forecast GFS dataset with lr) contains forecast data every 6 hours from forecast hours 240 to 384 on a 1.0 degree latitude/longitude grid covering the globe.

  • SURFACE FIELDS:
    • PRSS MSLP TPP6 UMOF VMOF SHTF DSWF RH2M U10M V10M T02M TCLD
  • UPPER-LEVEL FIELDS:
    • (1000 975 950 925 900 850 800 750 700 650 600 550 500 450 400 350 300 250 200 150 100)
    • HGTS TEMP UWND VWND RELH WWND
    • (50)
    • HGTS TEMP UWND VWND RELH
    • (20)
    • HGTS TEMP UWND VWND
  • Filenames on FTP servers:
    • hysplit.tXXz.gfslrf, where XX is the cycle
More Information | NCEP Model Analysis and Forecasts

GFS (0.25 degree, sigma-pressure hybrid) Model

The Global Forecasting System (GFS) quarter-degree latitude-longitude grid contains sigma-pressure hybrid level forecast model output every 3 hours from forecast hours 0 to 84 covering the globe (each file contains 8 time periods or 1 day).

  • SURFACE FIELDS:
    • PRSS MSLE UMOF VMOF TPP6 SHTF DSWF SPH2 U10M V10M T02M TCLD PBLH LHTF USTR RGHS PTRO (PTRO-pressure of tropopause) SHGT
  • UPPER-LEVEL FIELDS: Note, these levels are pressure-sigma hybrid levels. The pressure level is defined as:

    P = A + .B*PRSS,

    where PRSS is the surface pressure and A.B is defined as the level (ie., 16.853 = 869 hPa when the surface pressure is 1000 hPa [P=16+0.853*1000])
    • (1.0000 0.9999 0.9947 0.9886 0.9817 0.9739 1.9648 1.9544 2.9425 4.9288 6.9132 8.8954 11.8750 16.8530 21.8270 26.7990 33.7690 41.7350 49.6990 59.6600 69.6190 80.5760 91.5310 102.4900 113.4400 123.3900 133.3500 143.3000 151.2600 157.2200 162.1800 165.1500 166.1200 165.0900 162.0700 157.0500 150.0400 142.0200 132.0100 122.0100 111.0000 99.0020 88.0000 78.0000 68.0000 59.0000 52.0000 45.0000 39.0000 34.0000 29.0000 25.0000 21.0000 18.0000 15.0000 13.0000)
    • TEMP UWND VWND RELH PRES
  • Filenames on FTP servers:
    • hysplit.tXXz.gfs0p25f, where XX is the cycle (all hours, large data set)
    • hysplit.tXXz.gfs0p25000, where XX is the cycle (hours 0 to +21)
    • hysplit.tXXz.gfs0p25024, where XX is the cycle (hours +24 to +45)
    • hysplit.tXXz.gfs0p25048, where XX is the cycle (hours +48 to +69)
    • hysplit.tXXz.gfs0p25072, where XX is the cycle (hours +72 to +84)
More Information | NCEP Model Analysis and Forecasts

HREF 5 km (pressure)

The High Resolution Ensemble Forecast model contains 10 members' pressure-level forecast data every hour from forecast hours 1 to 30. Six members from HIRESW and two members from HRRR are on a ~5 km 1031 x 596 grid covering the continental U.S. The remaining two members from NAM are on a ~3 km 1792 x 1059 grid.
Domain map of HREF 5 km.

  • SURFACE FIELDS:
    • PRSS MSLP TPP3 SHTF DSWF RH2M U10M V10M T02M TCLD SHGT CAPE PBLH SOLM LHTF
  • UPPER-LEVEL FIELDS:
    • (1000 975 950 925 900 875 850 825 800 775 750 725 700 650 600 550 500 450 400 350 300 250 200)
    • HGTS TEMP UWND VWND WWND RELH
  • Filenames on FTP servers:
    • hysplit.tXXz.rens.hiresw.m01 (fv3, same cycle), where XX is the cycle
    • hysplit.tXXz.rens.hiresw.m02 (fv3, 12-hours' prior cycle), where XX is the cycle
    • hysplit.tXXz.rens.hiresw.m03 (hiresw/arw, same cycle), where XX is the cycle
    • hysplit.tXXz.rens.hiresw.m04 (arw similar to NSSL arw, same cycle), where XX is the cycle
    • hysplit.tXXz.rens.hiresw.m05 (hiresw/arw, 12-hours prior cycle), where XX is the cycle
    • hysplit.tXXz.rens.hiresw.m06 (arw similar to NSSL arw, 12-hours prior cycle), where XX is the cycle
    • hysplit.tXXz.rens.hrrr.m01 (HRRR, same cycle), where XX is the cycle
    • hysplit.tXXz.rens.hrrr.m02 (HRRR, 6-hours' prior cycle), where XX is the cycle
    • hysplit.tXXz.rens.nam.m01 (NAM conusnest, same cycle), where XX is the cycle
    • hysplit.tXXz.rens.nam.m02 (NAM conusnest, 12-hours' prior cycle)
  • Additional symbolic links on ARL FTP servers:
    • hysplit.tXXz.href.m01 -> hysplit.tXXz.rens.hiresw.m01
    • hysplit.tXXz.href.m02 -> hysplit.tXXz.rens.hiresw.m02
    • hysplit.tXXz.href.m03 -> hysplit.tXXz.rens.hiresw.m03
    • hysplit.tXXz.href.m04 -> hysplit.tXXz.rens.hiresw.m04
    • hysplit.tXXz.href.m05 -> hysplit.tXXz.rens.hiresw.m05
    • hysplit.tXXz.href.m06 -> hysplit.tXXz.rens.hiresw.m06
    • hysplit.tXXz.href.m07 -> hysplit.tXXz.rens.hrrr.m01
    • hysplit.tXXz.href.m08 -> hysplit.tXXz.rens.hrrr.m02
    • hysplit.tXXz.href.m09 -> hysplit.tXXz.rens.nam.m01
    • hysplit.tXXz.href.m10 -> hysplit.tXXz.rens.nam.m02

    More Information | NCEP Model Analysis and Forecasts


    GEFS

    The Global Ensemble Forecast System model contains 31 members' pressure-level forecast data every three hours from forecast hours 0 to 84 on a global half-degree latitude by longitude 720 x 361 grid.
    Domain map of GEFS.

    • SURFACE FIELDS:
      • PRSS MSLP TPP6 UMOF VMOF SHTF DSWF RH2M U10M V10M T02M TCLD SHGT CAPE PBLH
    • UPPER-LEVEL FIELDS:
      • HGTS TEMP UWND VWND RELH WWND
      • (RELH is not available at 20 hPa; WWND is not available at 50 and 20 hPa)
      • (1000 975 950 925 900 850 800 750 700 650 600 550 500 450 400 350 300 250 200 150 100 50 20)
    • Filenames on FTP servers:
      • hysplit.tXXz.gefs.gec00, control, where XX is the cycle
      • hysplit.tXXz.gefs.gepNN, where XX is the cycle and NN the perturbation number (01 - 30)

    More Information | NCEP Model Analysis and Forecasts