The use of several menu features is demonstrated here that will permit the creation of a map of the concentration plume with political boundaries and contours of the terrain as defined by the meteorological data. The basic process is to create a shapefile of the terrain and add that file to a shapefile of the political boundaries. Although this demonstration is for terrain and concentration any line or contour based shapefile can be displayed through the concentration or trajectory plotting programs.
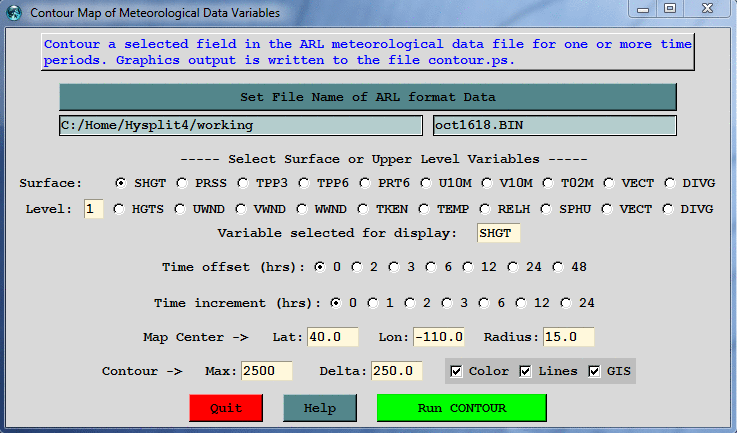
Open the Meteorology / Display Data / Contour Map menu and select the meteorological data file, the station height field (SHGT=terrain), and set the GIS checkbox, which will output the terrain field in generate format. It might be necessary to force the contours and the center of the map to get a nice looking display over the region of interest. In this case for the west coast of the U.S. the maximum terrain height was set to 2500 m with an interval of 250 meters between contours.
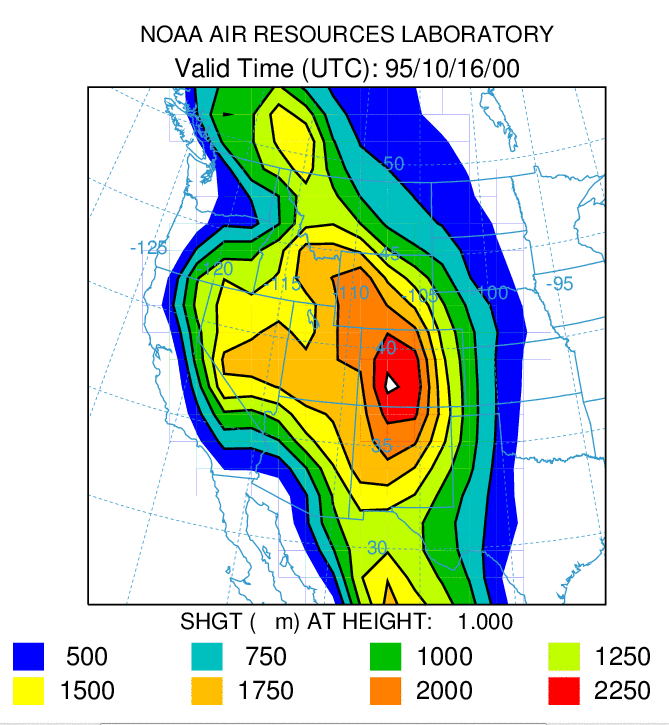
Run the contour program and the display shown below will be created. In the working there will be an additional file called GIS_METEO_01.txt which is the generate format text file of the terrain contours.
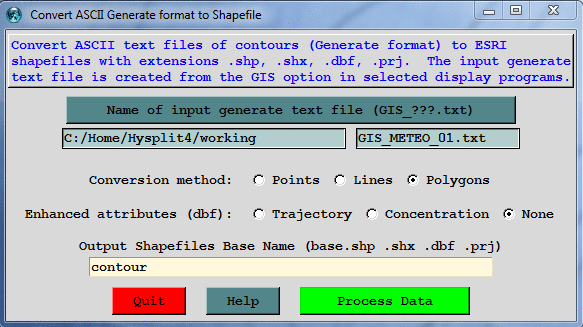
Now open the GIS to Shapefile utility menu and browse for the generate format file name. Select the "Polygons" radiobutton to insure that the terrain polygons are treated as closed connected lines. After processing the input file, four output files will be created with the base name of contour. The subsequent plotting programs only need the contour.shp file, but the other files may be needed for import into other GIS applications.
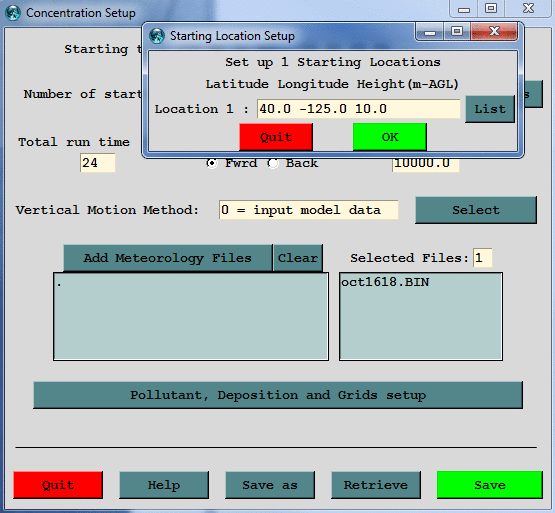
If you do not have a plume simulation already completed, open the concentration setup menu and run the default test case, but move the starting location to 40N 125W and run the model for 24 rather than 12 hours. To simplify the output, set the concentration grid averaging time to 24 h and reduce the grid resolution from 0.05 to 0.10. Then run the model.
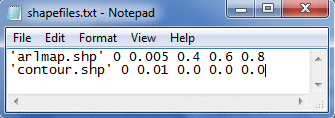
After the run completes, go to the hysplit/graphics directory and copy arlmap.shp and shapefiles_arl.txt to the working directory. Rename shapefiles_arl.txt to shapefiles.txt. Then open notepad in working to edit shapefiles.txt to add the additional file (line) defining the shapefile with the terrain. For this display, the line is twice as thick as the map background and the color is defined as black (0.0 0.0 0.0).
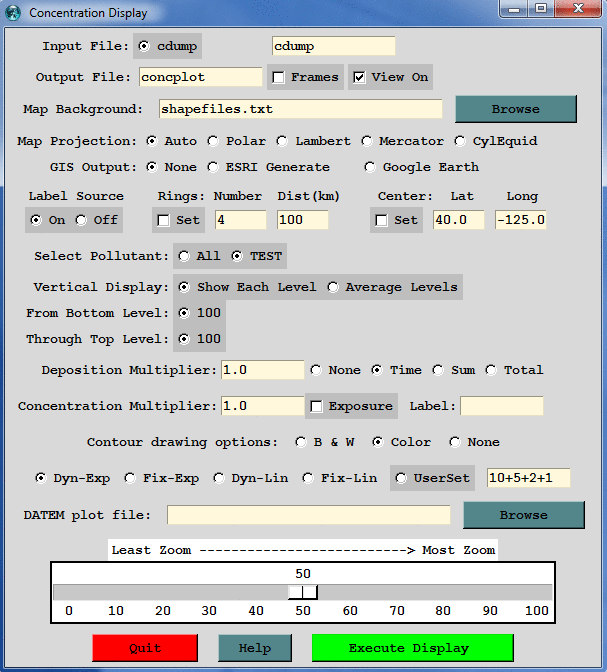
Now open the concentration / display / contours menu and define the shapefiles.txt in the field for the map background. This will cause the display program to use the files defined in this file rather than the default map background. Multiple shapefiles can be displayed at the same time.
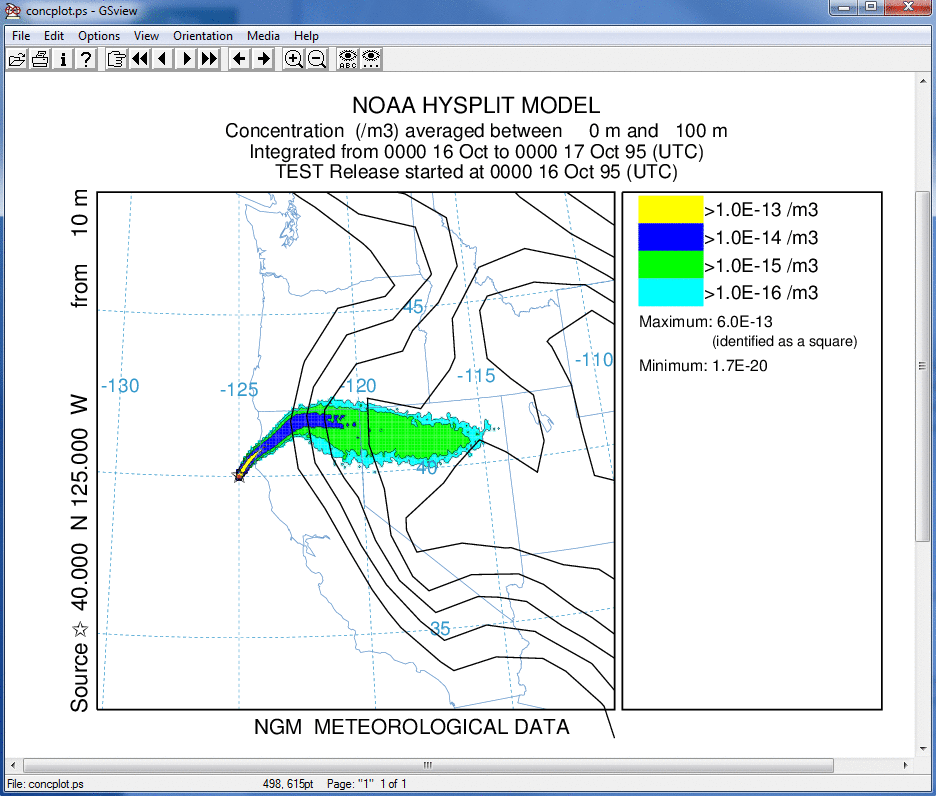
Executing the display will result in the following image showing the intersection of the plume with the elevated terrain as it moves to the east.