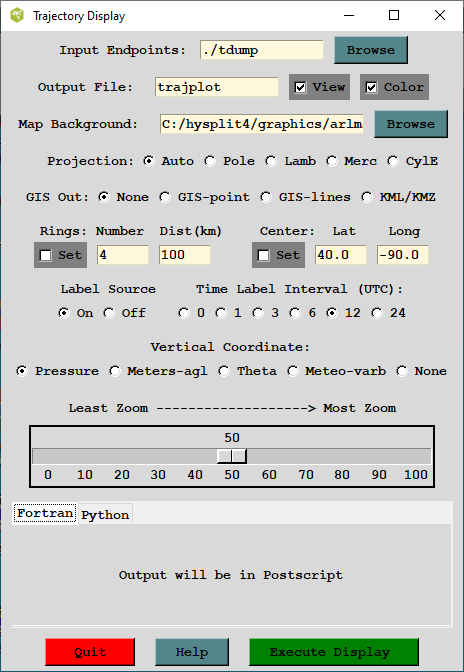
The trajectory model generates a text output file of end-point positions. The end-point position file is processed by trajplot to produce the Postscript display file. Trajplot can be accessed through the GUI or run directly from the command line. The display program has a variety of command line options, most of which are available through the GUI. There is a one-to-one relationship between GUI options, an example of which is shown below, and the command line options. There are several features particular to the GUI. First the Trajectory Display menu will not open unless the Trajectory Setup menu was first opened and Saved. This procedure sets all the GUI parameters to their default_traj values. These are the values shown in the Display menu. Normally the map projection is computed automatically based upon the location and length of the trajectory. However some trajectory combinations may give no maps or improperly scaled maps. In these situations one would want to over-ride the default projection and try forcing a selection.
Trajplot has an additional implementation in the Python language. By default, the GUI uses trajplot built from FORTRAN code. To use the Python implementation, select the Python tab near the bottom of the user interface before generating a plot.
The Postscript conversion program trajplot reads the trajectory endpoints output file, calculates the most optimum map for display, and creates the output file - trajplot.ps. When executed from the command line, there are several Unix style command line options. There should be no space between the option and any arguments: trajplot -[options (default)]
-a[GIS Output: 0-none, 1-ESRI Generate, 3-Google Earth]
Selecting the ESRI Generate format output creates an ASCII text file for each output time period that consists of the value and latitude-longitude points along each trajectory. This file can be converted to an ESRI Shapefile or converted for other GIS applications through the utility menu "GIS to Shapefile. The view checkbox would be disabled to do just the GIS conversion without opening the Postscript viewer. Selecting Google Earth will create a compressed file (*.kmz) for use in Google Earth; a free software package to display geo-referenced information in 3-dimensions. You must have the free Info-Zip file compression software installed to compress the Google Earth file and associated graphics. The Python implementation can take several formats. See the description for the --more-gis-options option below.
-e[End hour to plot: #, (all hours)]
-f[Frames: (0)-all frames in one file 1-one frame per file]
-g [Circle overlay: ( )-auto, #circ (4), #circ:dist(km)]
+g[Graphics type: (0)-Postscript, 1-SVG]
= 0 - Output in Postscript.
= 1 - Output in HTML containing Scalable Vector Graphics.
Note that this option is unavailable in the Python version.
-h [Hold map at center lat-lon: (source point), lat:lon]
-i[Input files: name1+name2+name3+... or +listfile or (tdump)]
-j[Map background file: (arlmap) or shapefiles.(txt|suffix)]
-k[Kolor: 0-B&W (1)-Color, N:colortraj#1,...colortraj#N]
-l[Label interval: -12, -6, 0, (6), 12, ... hrs]
-L[LatLonLineLabels]
-m[Map projection: (0)-auto 1-polar 2-lambert 3-mercator 4-CylEqu]
-o[Output file name: (trajplot.ps)]
-p[Process file name suffix: (ps) or process ID}
-s[Symbol at trajectory origin: 0-no (1)-yes]
-v[Vertical: 0-pressure (1)-agl 2-isentropic 3-meteorology 4-none]
-z[Zoom factor: 0-least zoom, (50), 100-most zoom]
Additional Trajplot Command Line Options for Python Implementation
The following options are available only to the Python trajplot.
--debug
Print debug messages. This is useful for developers to diagnose an issue.
--interactive
Enter interactive mode. Users can zoom in or move the plot area.
--more-formats=f1[,f2,...]
Specify one or more additional output format(s). This option supplements the output format specified by the -o option. For example, for -oa.ps --more-formats=pdf,png, three files would be produced, namely, a.ps, a.pdf, and a.png. Supported formats are eps, jpg, pdf, pgf, png, ps, raw, rgba, svg, svgz, and tif.
--more-gis-options=f1[,f2,...]
Specify one or more additional GIS output format(s). This option supplements the -a option. For example, with -a1 --more-gis-options=3, both ESRI Generate and Google Earth files will be created.
--source-time-zone
Display dates and times as a local time at the source location. If the option is not given, dates and times will be in Coordinated Universal Time (UTC).
--street-map[=n]
Show street map in the background. Currently, the option value n may take 0 (OPEN_STREET) or 1 (OPEN_TOPO). If no option value is used (i.e., --street-map), n = 0 will be used. This option overrides the -j option.
--time-zone=tz
Show dates and times as a local time at the given time zone tz. The time zone should be listed in the pytz Python package. For example, it could be US/Eastern, America/New_York, Etc/GMT-5, and so on.
Additional Map Label Customization
Many of the Postscript graphics programs have label information that can be customized to some extent. This is accomplished by placing a file called Labels.cfg in the startup directory which contains the following valid entries (all in single quotes terminated by &) replacing the new string with the desired text. A sample file called Labels.bak may be found in the relevant directory. Not all label strings are valid with every plotting program. For instance with trajplot, only the title entry would be used to replace the top label line of the plot.
Additional supplemental text may be added at the bottom of the graphic by creating a file called MAPTEXT.CFG, also to be located in the startup directory. This is a generic file used by all plotting programs but each program will used different lines in its display. The file can be created and edited through the Advanced menu tab.
Standard ASCII Map Background File
By default, all mapping programs use the same text map background file, arlmap, which normally would be located in the ../graphics directory. However, all graphics programs first search the local start directory (../working if running the GUI), then the ../graphics directory. Customized map background files can be read instead of the default file for specialized applications. Some higher resolution map background files are available from the HYSPLIT download web page. These different map files may be accessed implicitly by putting them in the "../working (the startup directory), or explicitly through the GUI by entering the name of the customized map background file. The map background file format consists of three or more records per graphic line with the following format:
ESRI Shapefile Map Background Files
Another mapping option would be to specify a special pointer file (originally called shapefiles.txt, but now a suffix other than "txt" is permitted) to replace the map background file arlmap in the -j command line option (see above). Note -jshapefiles... rather than -j./shapefiles... is required. This file would contain the name of one or more shapefiles that can be used to create the map background. The line characteristics (spacing, thickness, color) can be specified for each shapefile following the format specified below: