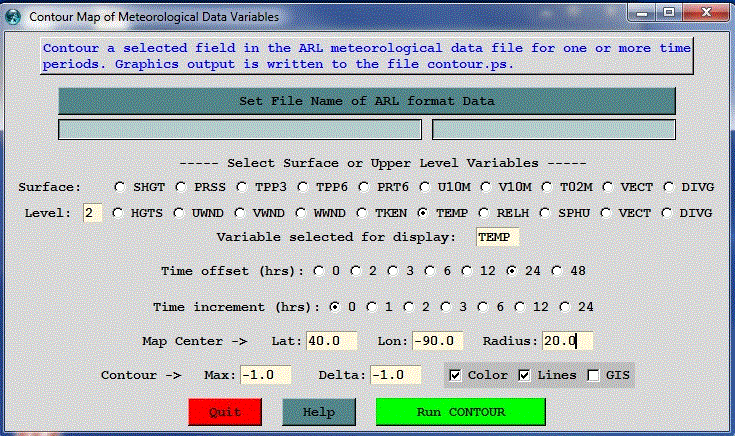
The contour display program, run from this menu, provides a simple tool to create a contour map for any variable at any time period in any ARL packed format meteorological data file. A simple configuration is available through the menu shown below. More options are available if the program is run through the command line.
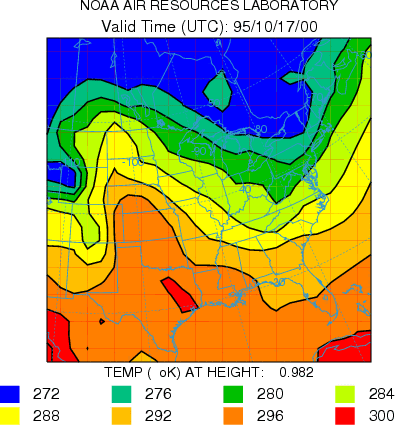
In the example shown above, the sample meteorological data file has been selected to display the temperature (TEMP) variable on model level #2. The time period to be shown is offset 24 hours from the first time period in the file. No additional time periods are shown when the increment is set to zero. The map will be centered about 40N 90W with a radius of 20 degrees latitude. The maximum contour value and the temperature difference (Delta) between contours will be determined automatically (-1.0). The radiobuttton default is to draw contour lines on top of the color fill.
For a latitude-longitude grid, the full grid cannot be plotted. Instead a sub-grid not centered at 0 deg latitude, 0 deg longitude must be set.
There are two additional derived display options available. Selecting the variable "VECT" will produce a wind vector plot and selecting "DIVG" will produce a plot of the wind field divergence. Both of these options require the U and V velocity fields at the selected level in the order of U followed by V.
The radio buttons show only the most common set of variables found in the meteorological data files. The menu does not know which variables are available in the selected file. The check file program can be used to examine the variables contained in each file. The variable selected for display using the radio-button may be superseded by replacing the text entry with the desired variable identification.
The output file contour.html is created in HTML format with scalable vector graphics. It is shown below, as displayed by the web browser, and may be converted to GIF through the Convert SVG menu tab.