2.2 CAPE Enhanced Vertical Mixing (2 min) |
||||
 Previous |
|
|
 Next |
|


In this example we use the convective available potential energy (CAPE) profile to enhance the vertical mixing in grid cells where heat is released due to condensation within a convective cloud. CAPE enhanced mixing results in particles in the cloud-layer being randomly redistributed within the cloud-layer if they reside in a grid cell where CAPE exceeds some threshold value. This option is not turned on by default because it does not diagnose convection but only the potential for convection. Furthermore, treating this option as a deterministic calculation is not advised because depending upon the meteorological grid size, it is unlikely that the entire grid cell would experience convection, nor would a narrow plume necessarily intersect the convective activity.
- To start configure the CONTROL file for the default test case simulation but set the one unit per hour emission rate for the duration of the 12 h simulation:
1 one pollutant TEST defined as a PM 2.5 particle 1.0 default emission rate one unit per hour 12.0 emission duration in hours - For the meteorology use the 0.5 degree GDAS data that was used for the Fukushima calculations because it covers the northern hemisphere tropics where convection is most likely during this time of the year. Select a starting location in Central America:
11 03 21 12 Start March 21 early morning 11.0 -84.0 10.0 Central American location C:/Tutorial/japan/ Directory of Fukushima 0.5 degree GDAS data gdas11-22.bin Northern hemisphere extract for 11-22 March - Create the SETUP.CFG namelist file and configure the 3D particle simulation using the default particle release rate but output the particle file after the first hour and every hour thereafter:
ndump = 1, Particle output file after the first hour ncycl = 1, Add to particle output file every hour - Now the calculation may be run and a particle cross-section plot (parxplot) should be created. The results can be viewed for each of the 12 hours to show how the particles fill the mixed layer. The particle cross-section after 6 hours (18 UTC) is shown below:
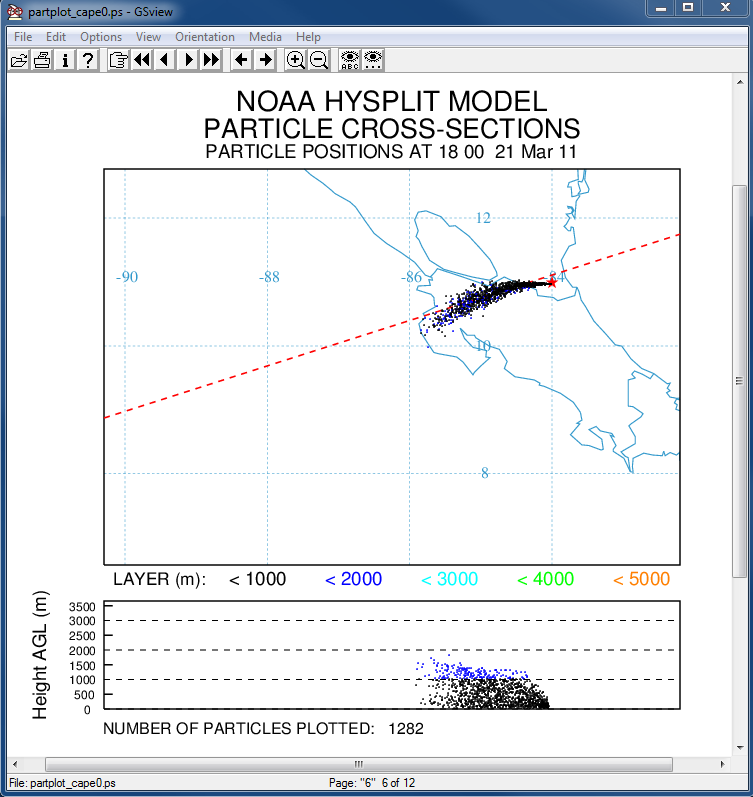
- To turn on CAPE enhanced mixing, the variable CAPEMIN should be defined in the SETUP.CFG file with a positive value. It defines the threshold value of CAPE (J/kg) to initiate enhanced vertical mixing. A value less than zero (default = -1) skips the CAPE computation such that if CAPE is not available in the input meteorological data file then it is NOT computed. CAPE computations can substantially increase the simulation time. A initial value of 500 J/kg is suggested to test this computation:
capemin = 500, CAPE enhanced mixing threshold - Now run the calculation again and create the particle cross-section plot. The particle cross-sections are the same as in the non-CAPE enhanced mixing until 18 UTC which shows a region of enhanced mixing over the land areas covering about one meteorological grid cell:
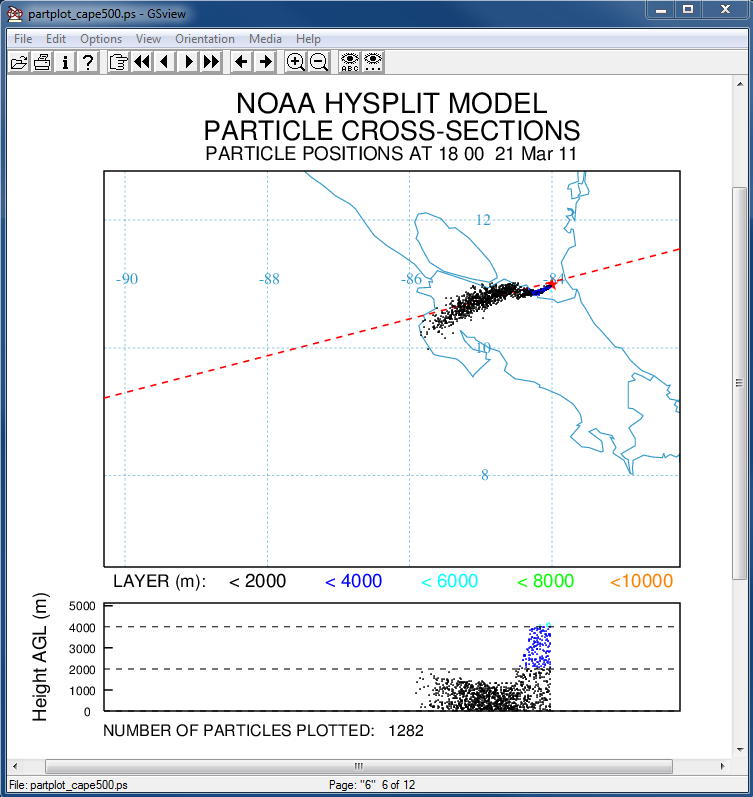 . An examination of the subsequent time periods (not shown here) shows the particles moving downward again after the enhanced mixing period. This is attributed to large scale downward vertical motion.
The enhancement of mixing in regions of convection may make a substantial difference for individual calculations. However, it is not really known whether it is realistic for any one calculation. It may be more realistic to apply the convective mixing enhancement only for longer-term climatological simulations.