This menu option permits the extraction of information for a specific source or receptor if the original model simulation was configured to produce a source-receptor matrix formatted output file. The model should have been run with the matrix option set in the configuration menu. This results in a special concentration output file that may be called a source- receptor matrix, such that each column may be considered a receptor location and each row a pollutant source location. The display program under this menu tab permits the contouring of any row or column.
If the matrix option was not set in the Advanced Concentration configuration tab, then the output file produced is a simple concentration output file, where the concentrations from all the sources of the defined matrix are summed on a single concentration output grid. Source-receptor information cannot be extracted from such a file.
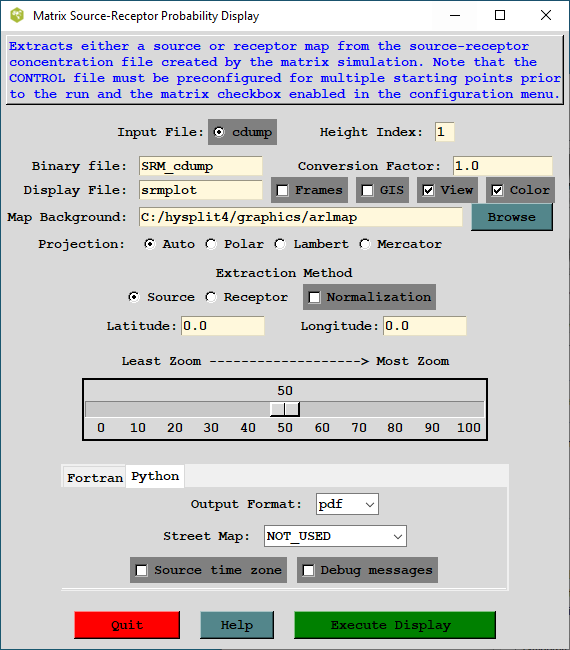
When a location is selected in the menu, a special program is called to extract that location from the concentration matrix output file and then write a standard concentration file for that location. The standard concentration display program is then used to display the information in the extracted file. The source-receptor matrix binary extraction file name will default to SRM_{original file name}, but can be changed in the menu. The Display Matrix menu, shown in the illustration below, automatically creates the extraction file, calls the standard display program concplot, and provides for additional custom label information to identify the plot as a source-receptor concentration matrix.
The menu consists of the standard display options such as the map background file, output file name, zoom factor, and the selection of the extraction method: source or receptor. A latitude and longitude point needs to be entered for all extractions. Selection of the "source" extraction method means that the location entered is considered to be the source location and the resulting output is a contour map is just a conventional air concentration simulation showing concentrations from that source. The "receptor" extraction method means that the location entered is considered to be the receptor location and the output is a map of how much air concentration each source contributes to the selected receptor. Note that turning on the "normalization" flag divides all concentrations by the sum of all concentrations at each grid point, resulting in a map that represents a fractional contribution. In addition, a concentration conversion factor can be defined, which will be applied to the binary file before it is contoured.