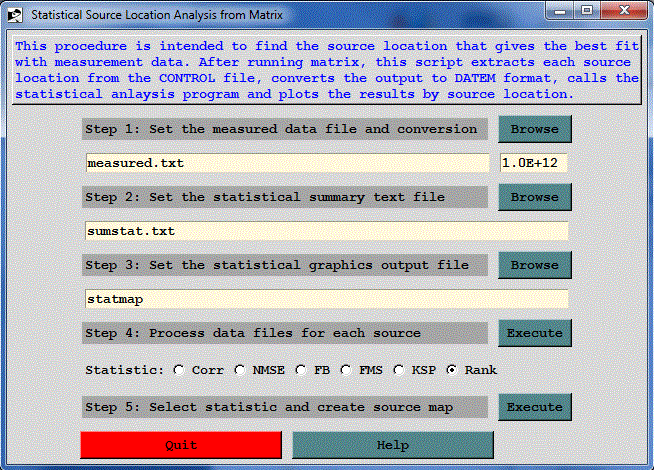
Summary: This procedure is intended to find the source location that provides the best fit with measurement data. After running HYSPLIT with the matrix option and ICHEM=1, the script extracts each source location from the CONTROL file, converts the output to the DATEM format, and then calls the statistical analysis program which is converted to a gridded binary file which can be plotted by any of the standard concentration plotting programs.
Step 1: defines the DATEM formatted measured data file and unit conversion factor required to convert the HYSPLIT concentration predictions to the same units as given in the measured data file.
Step 2: defines name of the statistical output file that will contain the statistical results from each source location compared with the measured data values. Normally the statmain program outputs one results file per execution. In this configuration, the results form each source location are appended to a single file, one record per source.
Step 3: defines the root name of the final output graphics file which will show a plot of the statistical results by source location. The .ps suffix is created by default.
Step 4: runs sequentially through all steps of the process, reading each source location from the CONTROL file, running matrix to extract that location from the HYSPLIT simulation output file, using c2datem to convert that binary extract to the DATEM format, and then running statmain to append the results to the statistical output file. This step needs only to be run once.
Step 5: defines which statistic will be shown: Corr - correlation coefficient, NMSE - normalized mean square error, FB - fractional bias, FMS - figure of merit in space, KSP - Kolmogorov Smirnoff parameter, and finally the rank, which is a combination of the previous parameters. Once all source locations have been processed, the statistical file is read and converted to binary gridded format using stat2grid. This output file can then be plotted with any of the display programs such as gridplot.
Default file names: The following describes the assigned default input and output files names for each processing section, so that they can be identified in the working directory. File names in italics are the ones that can be changed through the menu.
matrix
c2datem
statmain
stat2grid