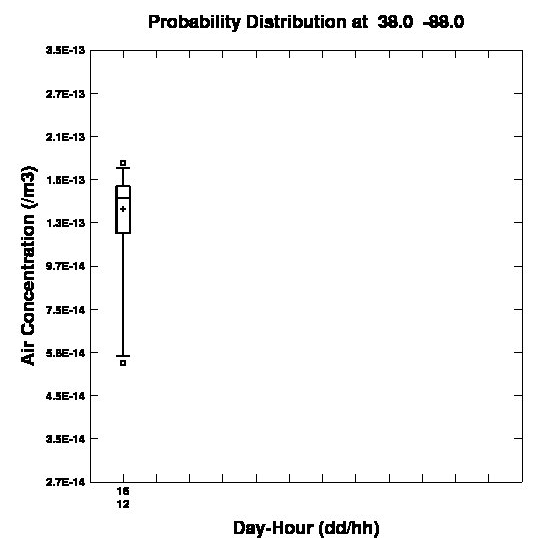
Multiple concentration output files from the ensemble or variance dispersion simulation can be processed to produce probability displays. The Ensemble / Create Files menu calls a special program conprob that reads the concentration files with the ensemble member three-digit suffix (001 to 999) and generates various probability files. Once these probability files have been created, the concentration distribution at a single location can also be viewed using this menu by entering a latitude-longitude location. The nearest grid point will be selected and the concentration values are retrieved from the prob{xx} files, which represent the various points on the box plot. In the illustration shown below, the limits of the box represent the quartiles (25th and 75th percentiles), the whisker extensions show the 10th and 90th percentiles, and the circles show the 5th and 95th percentiles. The median value is shown by the line through the box, while the mean is shown by the plus symbol. Up to 12 time periods can be shown in one plot. The graphic is always named boxplots.html.

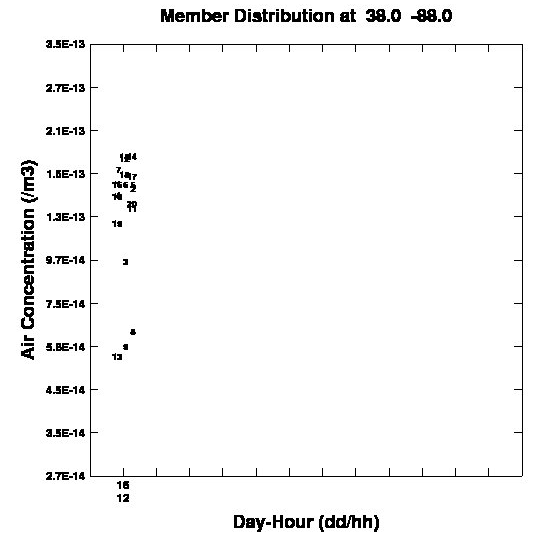
A second graphic called ensplots.html is always produced using the individual ensemble concentration files. The abcissa and ordinate is identical to the boxplot, but the contents show the actual concentration values identified by member number, where the number is the same as the concentration file suffix.
