Multiple concentration output files from the ensemble or variance dispersion simulation can be processed to produce probability displays. This file creation step is required to create the files that are needed by the Ensemble / Display / View Map and Box Plot tabs.
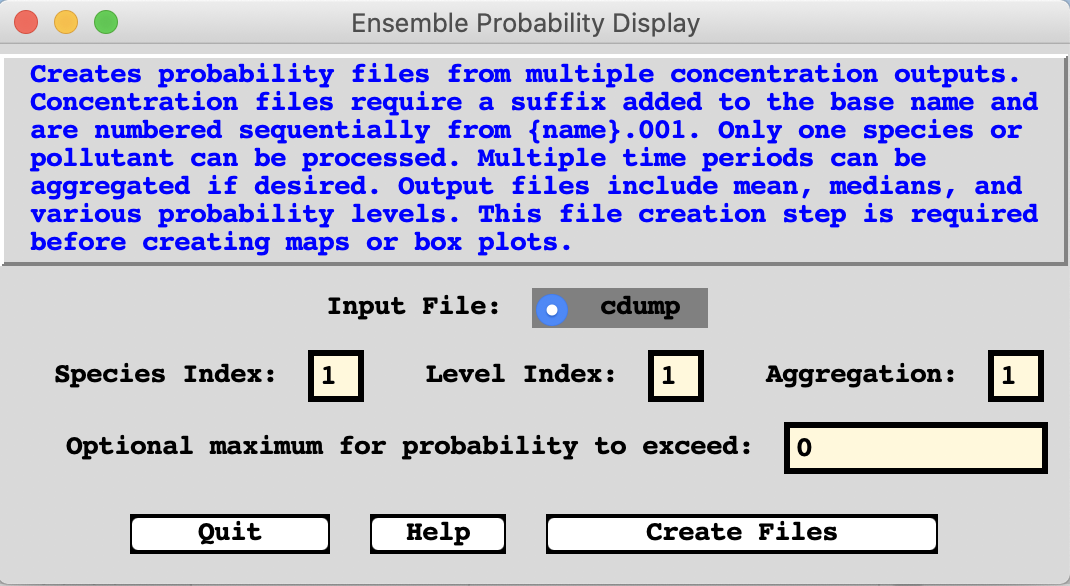
The Create Files menu calls a special program conprob that reads all the existing concentration files with a three-digit suffix (001 to 999) and generates various probability files. The Create Files menu can be used to convert multiple concentration output files to probability form, regardless of how they were generated. It is not necessary to use the pre-configured ensemble version of the model to create the ensemble members. Any number of multiple simulations can be used as long as the file suffixes end with a numeric three-digit sequence. Menu settings for the output file name should reflect the base name without the numeric suffix. An illustration of the Ensemble Create Files menu is shown below.
The creation of probability files is limited to one pollutant species and/or one concentration level. If the input files contain more than one of either, the index number of the desired species and level should be entered. The Aggregation number defaults to one, which means that only the ensemble members for one time period are aggregated together to produce the probability display. Hence there would be an independent probability map for each time period. However, multiple time periods may be combined to produce a single probability plot. The Aggregation entry represents the number of time periods, not the actual time span. For instance, if the model output is set to produce a one-hour average and the model is run for 24 hours, then each ensemble member will have 24 time periods of output. By default the probability output will represent the ensemble member variation for each hour, that is 24 frames of output will be produced. However if the aggregation period is set to 24, then all output times will be combined into one output frame and the ensemble result will represent the hourly variations as well as the member variations.
The last entry is optional and it represents the maximum concentration at which the probability to exceed certain concentration values are calculated. Leaving the field equal to zero causes the program to use the order-of-magnitude value just below the maximum concentration value of any member. If a value is set, then the program computes the probabilities to exceed the set maximum, and the probabilities at 10% and 1% of that value.
The Create Files button runs the conprob extraction program, which will always produce all the probability variations, one to each output file, for a given aggregation period, in the working directory. The conprob output files contain the following information:
The command line options for the probability program conprob [-options] are as follows: