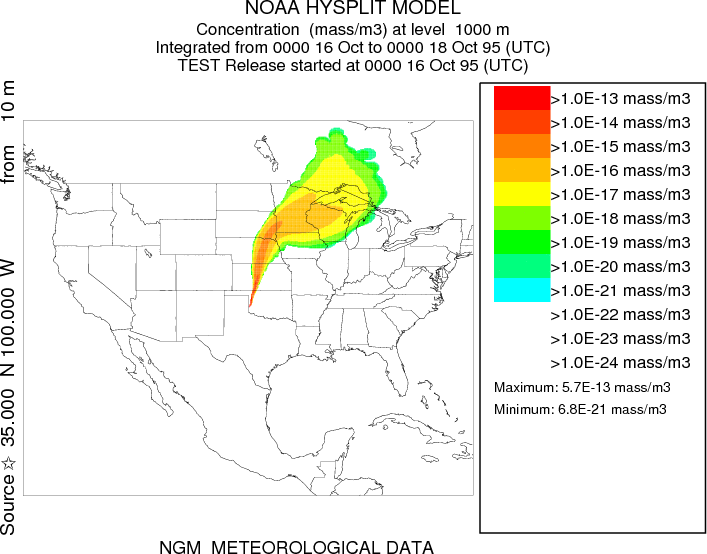
A generic Postscript equivalent of the Windows-only concentration grid point data display program is available through this menu. This particular program (gridplot) was designed to plot global sized concentration grids, although any sized grid may be displayed. Concentration values over the entire grid (or a zoomed area) will be shown using a color-fill in each grid cell according to its concentration value. The options available through the GUI are setting the input file, output file, lowest contour value, contour interval, species number, linear or logarithmic scaling, and the longitude offset, the center latitude, the zoom factor, the concentration multiplier, and the choice of GIS output. By default, each time period is output to a different file name, gridplot_{???}.html, where the sequence number {???} is incremented by one for each time period. When called from the Global Grid menu tab, the default output file name is gemplot rather than gridplot.
Several other options are available through the command line, which may be needed if multiple levels have been written to the concentration output file. USAGE: gridplot -[options(default)]

When called from the Global Grid menu tab, an additional feature is available through the Add Plume checkbox. In this case, the first plume model concentration grid (if more than one is defined) is added to the global model concentration grid as defined in this menu. The merged concentration file is called concadd.bin which is then displayed by gridplot. The two concentration files that are added must be identical in terms of the number levels and pollutants. However, the spatial grid characteristics may be different. The height of the levels at each index do not have to be identical. If this issue is important, then the heights heights corresponding to the global model heights needs to be set in the CONTROL file setup menu. Note that the global model vertical heights cannot be changed by the user and correspond with the heights of the meteorological data levels. The horizontal characteristics of the output grid always takes the grid dimensions of the second grid (-b).
USAGE: concadd -[options(default)]