The Trajectory Cluster Analysis window has the series of tasks necessary for running a trajectory cluster analysis. This differs from most, if not all, other HYSPLIT GUI windows that only run one program or do one task. Given a set of trajectories beginning at one location, the cluster analysis will objectively result in sub-sets of trajectories, called clusters, that are each different from the other sub-sets. The program will usually produce at least one possible outcome set of clusters. If more than one outcome is given, the user must then subjectively choose one for the final result. The trajectories to be clustered can be created in a variety of different approaches. Trajectory output file names should begin with a common base name as defined in the setup menu tdump and are then followed by some arbitrary identification text (e.g. date), for example, as created by the Run Daily menu option.
Cluster member trajectories are assigned based on latitude and longitude as described below, not height. Diagnostic variables (precipitation, etc) in the trajectory endpoints files are ignored.Description of clustering process:
Initially, total spatial variance is zero. Each trajectory is defined to be a cluster, in other words, there are N trajectories and N clusters. For the first iteration, which two clusters (trajectories) are paired? For every combination of trajectory pairs, the cluster spatial variance (SPVAR) is calculated. SPVAR is the sum of the squared distances between the endpoints of the cluster's component trajectories and the mean of the trajectories in that cluster. Then the total spatial variance (TSV), the sum of all the cluster spatial variances, is calculated. The pair of clusters combined are the ones with the lowest increase in total spatial variance. After the first iteration, the number of clusters is N-1. Clusters paired always stay together.
D = distance between a trajectory endpoint and the corresponding cluster-mean endpoint
SPVAR = SUM(all trajectories in cluster) [SUM(all trajectory endpoints) {D*D} ]
TSV = SUM(all SPVAR)
For the second iteration, which two clusters are paired? The clusters are either individual trajectories or the cluster of two trajectories that were initially paired. Again every combination is tried, and the SPVAR, and TSV for each is calculated. The two clusters combined are the ones that result in the lowest increase in TSV. The percent change in TSV and number of clusters (N-2) are written to a file.
The iterations continue until the last two clusters are combined, resulting in N trajectories in one cluster.
In the first several clustering iterations the TSV increases greatly, then for much of the clustering it typically increases at a small, generally constant rate, but at some point it again increases rapidly, indicating that the clusters being combined are not very similar. This latter increase suggests where to stop the clustering and is clearly seen in a plot of percent change in TSV vs. number of clusters, where the number of clusters are decreasing to the right on the plot. The iterative step just before (to the left of on the plot) the large increase in the change of TSV gives the final number of clusters. Typically there are a few "large" increases.
How to run the cluster analysis:
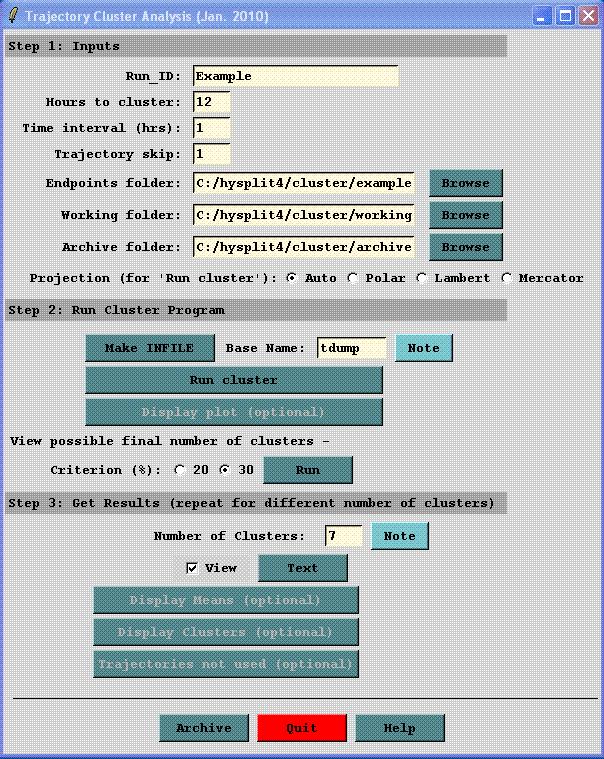
The window shown is from the Run Example case. For Run Standard, the Run_ID is "Standard", Hours to cluster is "36", the Endpoints folder (directory) is "c:/hysplit/cluster/endpts", and the Number of clusters is set to "1". Run Example performs cluster analysis on the example set of 12-h duration forward trajectories. Note one of the trajectories has a duration less than 12 hours and so it is not clustered. The number of trajectories in the example set is small to keep the cluster section of the HYSPLIT PC package a reasonable size.
Step 1. Inputs.
Run ID - A label to identify each run. The label ends at the first blank space. The other numeric inputs may be part of the label. For instance if trajectories during 2004 from Ohio were clustered, the Run_ID could be Ohio_2004. If you used 48-h trajectories, hourly endpoints, and every other trajectory, a label of Ohio_2004_48_1_2 could be used. If you later decided to only use the first 36-h of the trajectory Ohio_2004_36_1_2 might be used.
Hours to cluster - Trajectory durations up to the given hour are used. Must be a positive number. Time is from trajectory origin whether backward or forward. Trajectories terminating before the given hour will NOT be included in the clustering. Premature terminations commonly result from missing meteorology data or the trajectory reaching the meteorological grid horizontal or top edge. 36 hours is typical.
Time interval - Identifies which endpoints along a trajectory to use. Typically every hourly endpoint is used (1). For long trajectories, skipping endpoints will save computational time.
Trajectory skip - Identifies which trajectories in a folder to use. A value of 1 means every trajectory will be used; 2 means every other trajectory; 5 every 5th trajectory, etc. Useful with very large sets of trajectories.
Endpoints folder - All trajectory endpoints files containing 'tdump' in their name in this folder will be used for clustering.
Working folder - Cluster files are written to this folder.
Archive folder - All cluster files may be moved to this folder for archiving or to remove the files from the working directory. For permanent archiving, the files need to be moved or renamed since they will be overwritten by files from subsequent runs.
Projection - Trajectory endpoint latitudes and longitudes are converted to grid points using the specified map projection in the main cluster program "Run cluster". The projection for the plots is specified separately in Step 3.
Step 2. Run Cluster Program. Possible solutions to the cluster analysis will be available at the end of this step.
Make INFILE. Trajectories must have been run previously, such as via TRAJECTORY-Special Simulations – Run Daily. All the trajectory endpoints files need to be in one folder and each must have the name “tdump” within its filename. In this step, a file, INFILE, listing all the “tdump” files will be created in the working folder.
Note on endpoints files - There can be only one trajectory per file. At least 16 trajectories are needed after trajectories are skipped, if specified.
Run Cluster The cluster analysis program is run here given the INFILE file, the trajectory endpoints files, and the above inputs. On a typical PC, a cluster run with 365 trajectories, 36-h duration, and using every hourly endpoint, will take a couple minutes. Going beyond several years of trajectories will result in a run that will take a long time and/or use much memory. A warning message is given for “larger” runs, but there can be hard to tell if a "large" job fails due to lack of memory and/or is feasible.
For example with 1100 trajectories it may appear not to be running. Try some intermediate runs - 600 trajectories, 900 trajectories - and note the run time. Add to the number of trajectories as reasonable. Let it run overnight. If it takes "too long", increase the "time interval" to say 2 to use every other trajectory endpoint and/or set the "trajectory skip" to say 3 to use every third trajectory. Another option to bypass possible GUI errors is to run cluster.exe from the command line. To do this, open the "Command Prompt" (for Windows, Start, All Programs, Accessories), cd to your cluster working directory (e.g. cd \hysplit\cluster\working), and run \hysplit\exec\cluster.exe. If the file with the input values CCLUSTER exists in the cluster working directory, cluster.exe will start running, otherwise you will be prompted for the input values. When done, "exit" the Command Prompt, and return to the GUI for the subsequent processing.
CLUSTER – trajectory start date/time and endpoints (tdump) filename for all the trajectories in INFILE; then for each pass, a listing of the trajectories in each cluster.
DELPCT – the change in total spatial variance of all the clusters from one pass to the next.
CLUSTERno – the filename and trajectory start date/time of trajectories, if any, not clustered; used to create cluster results (CLUSLIST)
CMESSAGE – diagnostics output file
Display plot (optional) shows the percent change in total spatial variance (TSV) for the final 30 iterations. This data is from the file DELPCT. Generally there can be seen at least one time when there is a large increase in the change of TSV, indicating that “different”, rather than “similar”, clusters are being paired and that the cluster process should stop before that occurs.
View possible final number of clusters. Typically a pairing of "different" clusters is indicated by a 30% change in the percent change in total spatial variance (see Step 2, Display plot). Run lists the possible final cluster numbers. If the 30% criterion does not identify any, the 20% criterion may be chosen. The maximum is arbitrarily set to 20 clusters.
Step 3 Get Results. This step may be repeated using different numbers of clusters. If you exit the GUI, but have not archived your results, enter the Run_ID and the Working folder again from Step 1, then continue with Step 3. If you have already archived the results, but want to try a different number of clusters, manually copy everything from the archive folder to the cluster working folder, enter the Run_ID and the Archive and working folders, then enter the number of clusters, etc.
Number of clusters Enter the final number of clusters, one of the values listed in Step 2, Run. In general, this will be a value where the plot from Step 2,Display plot shows a sharp upward turn.
Assign trajectories to clusters "Run" creates a text file listing the trajectory start date/times and filenames in each cluster (CLUSLIST_NF, where NF is the final number of clusters). Note Cluster #0 is for trajectories not clustered. Depending on the application, this text file may be the outcome and the plots below may not be needed.
Display Means produces one map with the mean trajectory for each cluster (1-NF), given the final number of clusters, NF. The arbitrary cluster number and percent of trajectories in each cluster are given.
Display Clusters produces one map for each cluster, showing the trajectories in each cluster.
Trajectories not used are those input to the cluster program, i.e. in the endpoints directory, and at the given skip interval, that terminate before the trajectory duration equal to the Step 1, Hours to cluster. This occurs when the trajectory reaches the meteorology grid edge or when there is missing meteorology. Trajectories not used immediately displays a plot showing the trajectories not used and opens the Trajectory Cluster Display window, from which the cluster-mean trajectories for the trajectories not used (cluster #0) and all the other clusters may be displayed. Note the plot showing the trajectories not used must have been previously created in Step 3, Display Clusters, though it is not displayed there.
Archive All files are moved, not copied, to the given directory. Files created in Step 3 contain the final number of clusters (NF) in their filename; hence output using various values of NF may be readily archived.