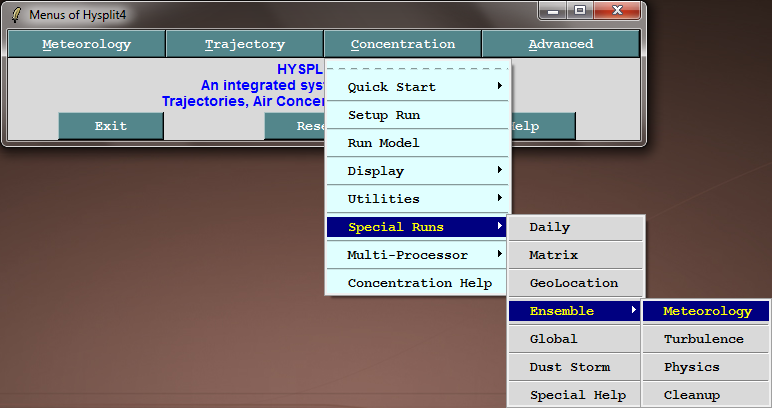
Meteorological Grid Ensemble |
- Shows how results are sensitive to the meteorology data grid
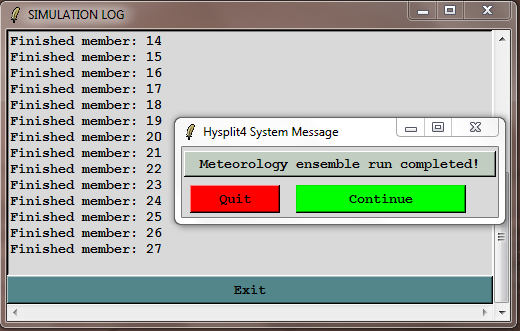
- Similar to the trajectory ensemble but output to 27 files (001-027)
- Post-processing sorts members at each grid point
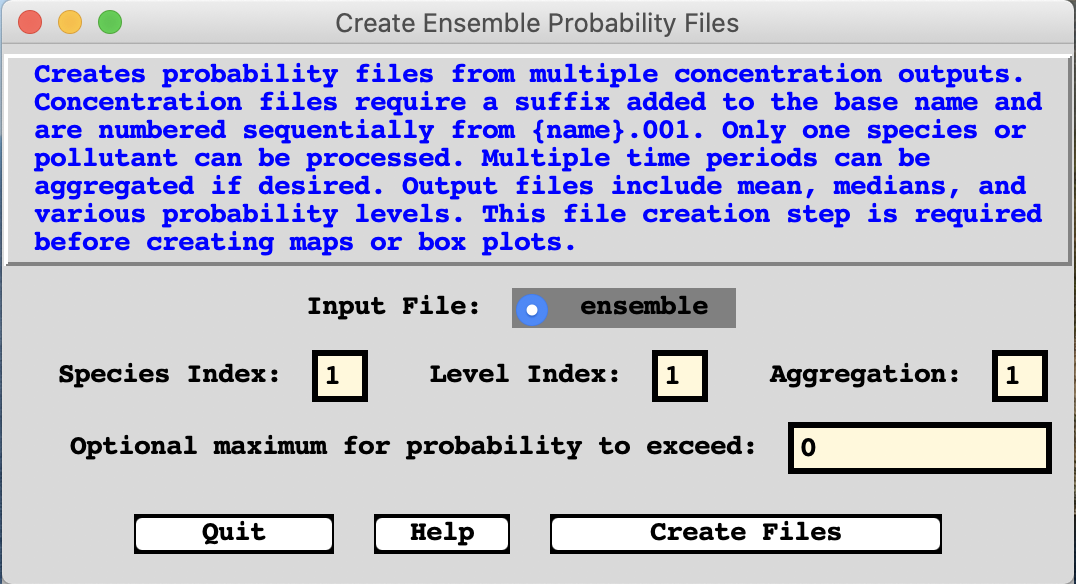
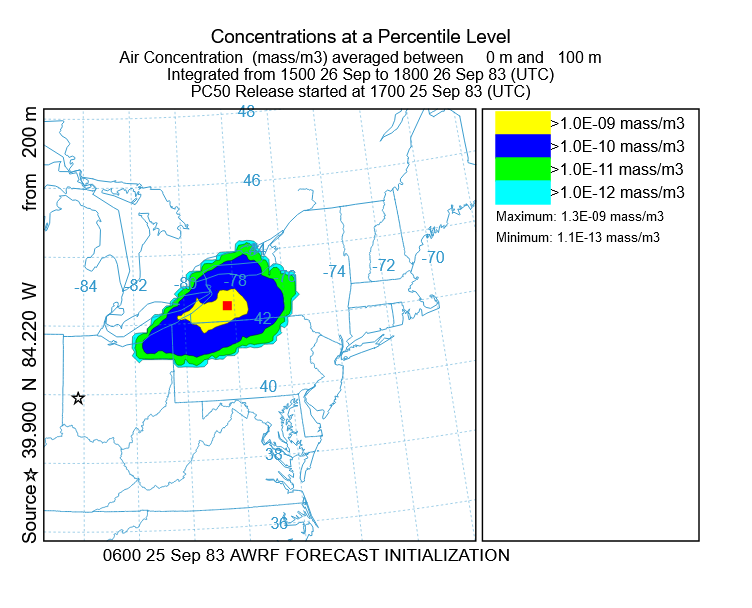
- Probability, mean, and variance output files available for display
captex_control.txt | load control file |
captex_setup.txt | load setup file |
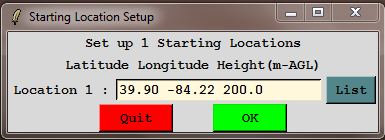
200 | release height |
49 (or 43) | run duration |
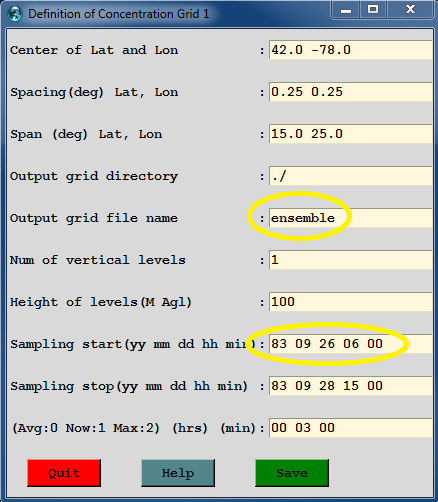
ensemble | output file name |
26 06 | sampling start time (to match station data) |
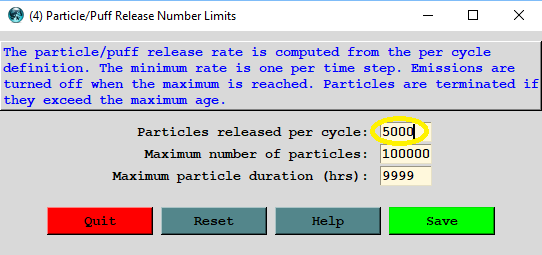
numpar = 5000 | namelist particle number |
ndump = 0 | namelist particle output start |
ncycl = 0 | namelist particle output interval |
ensemble_control.txt | save control file |
ensemble_setup.txt | save setup file |
Run Ensemble Model
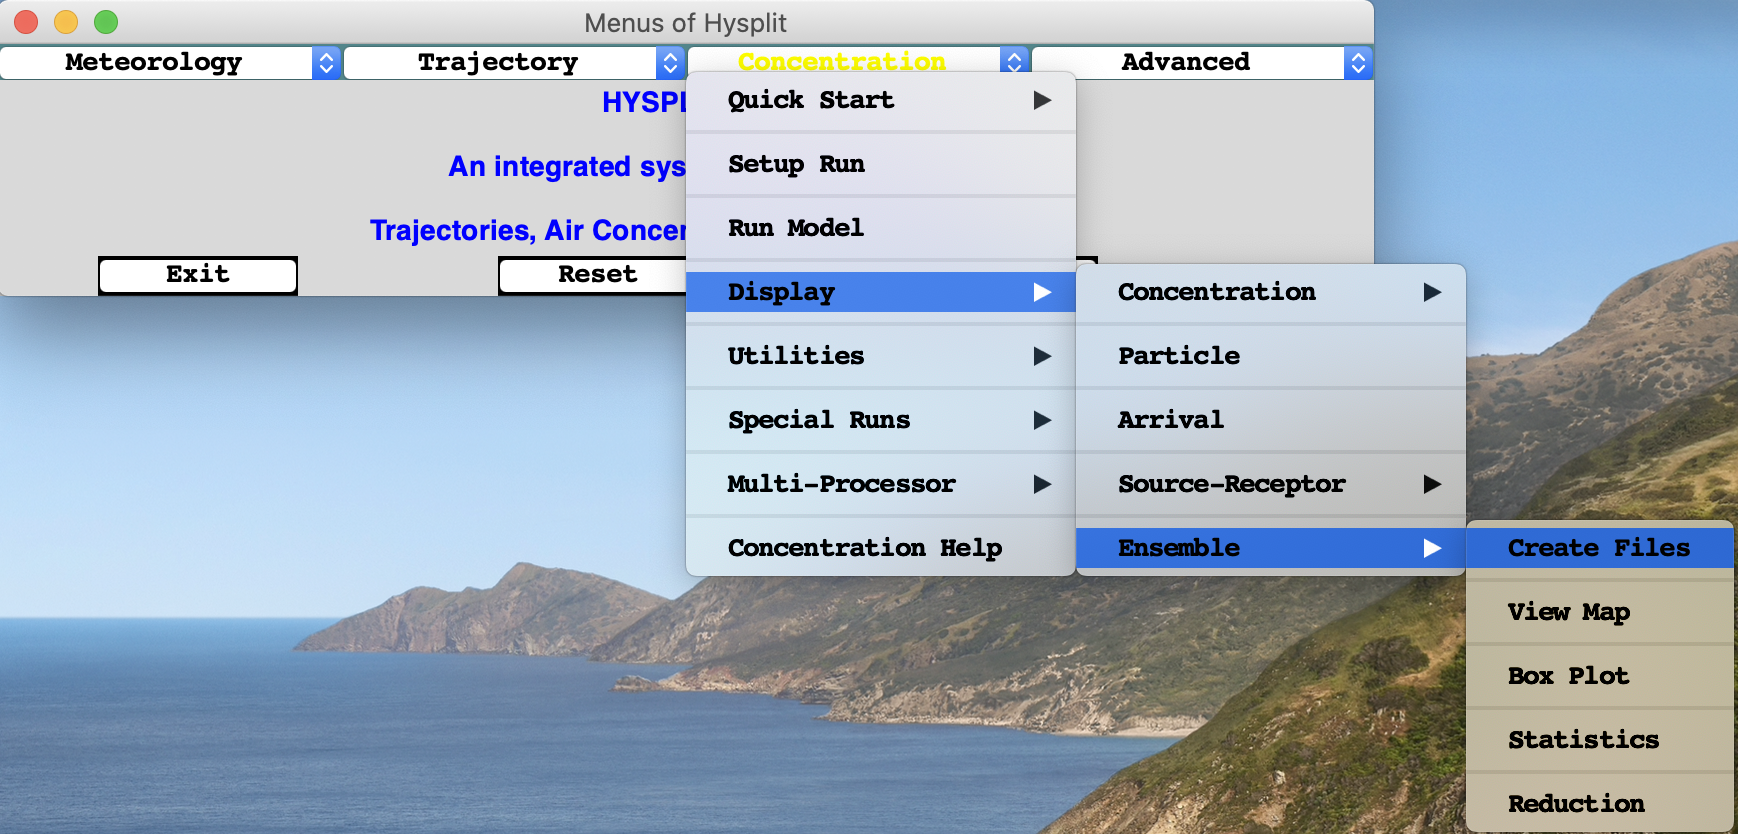
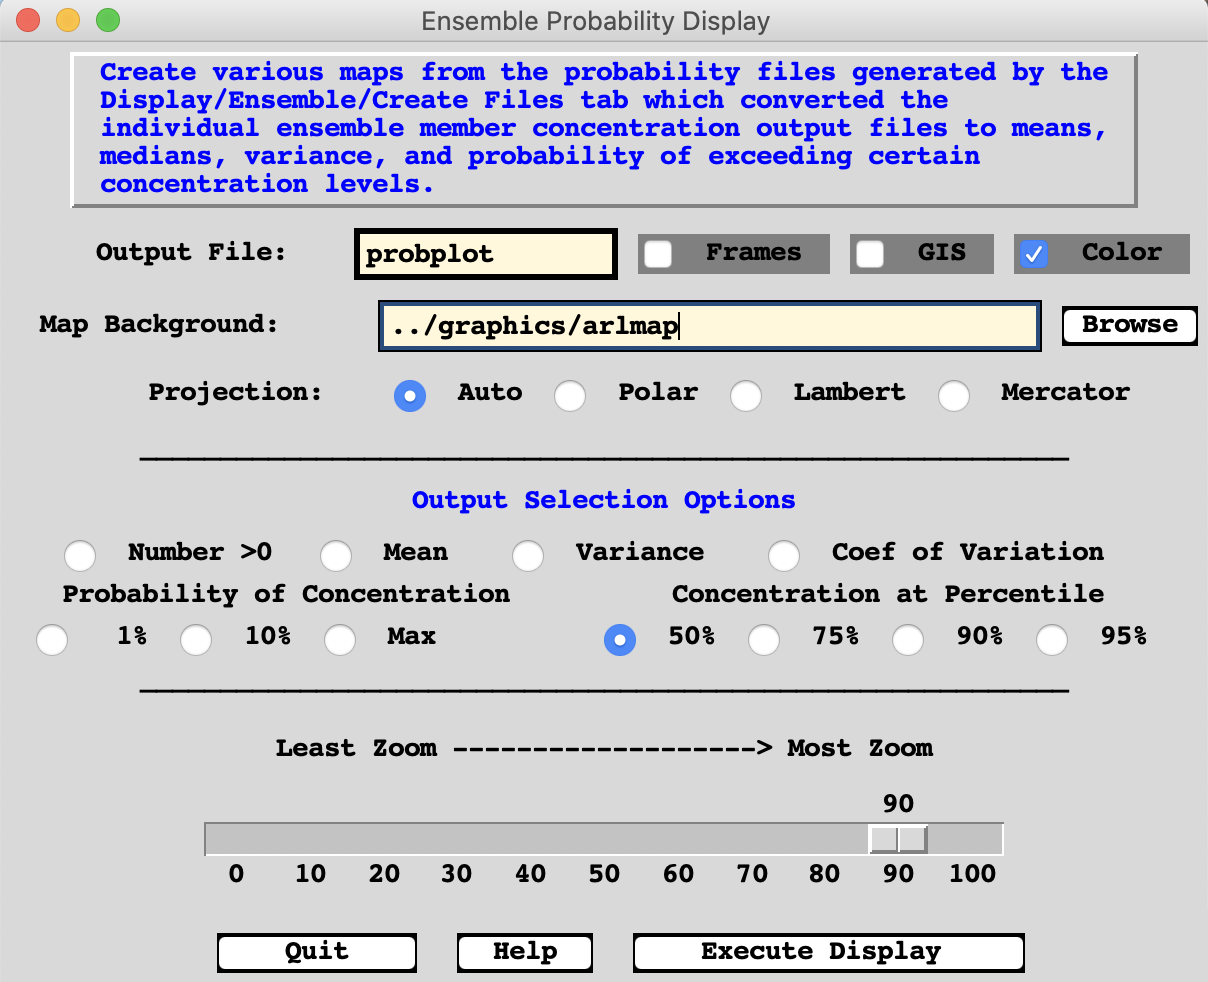
Create Probability Files
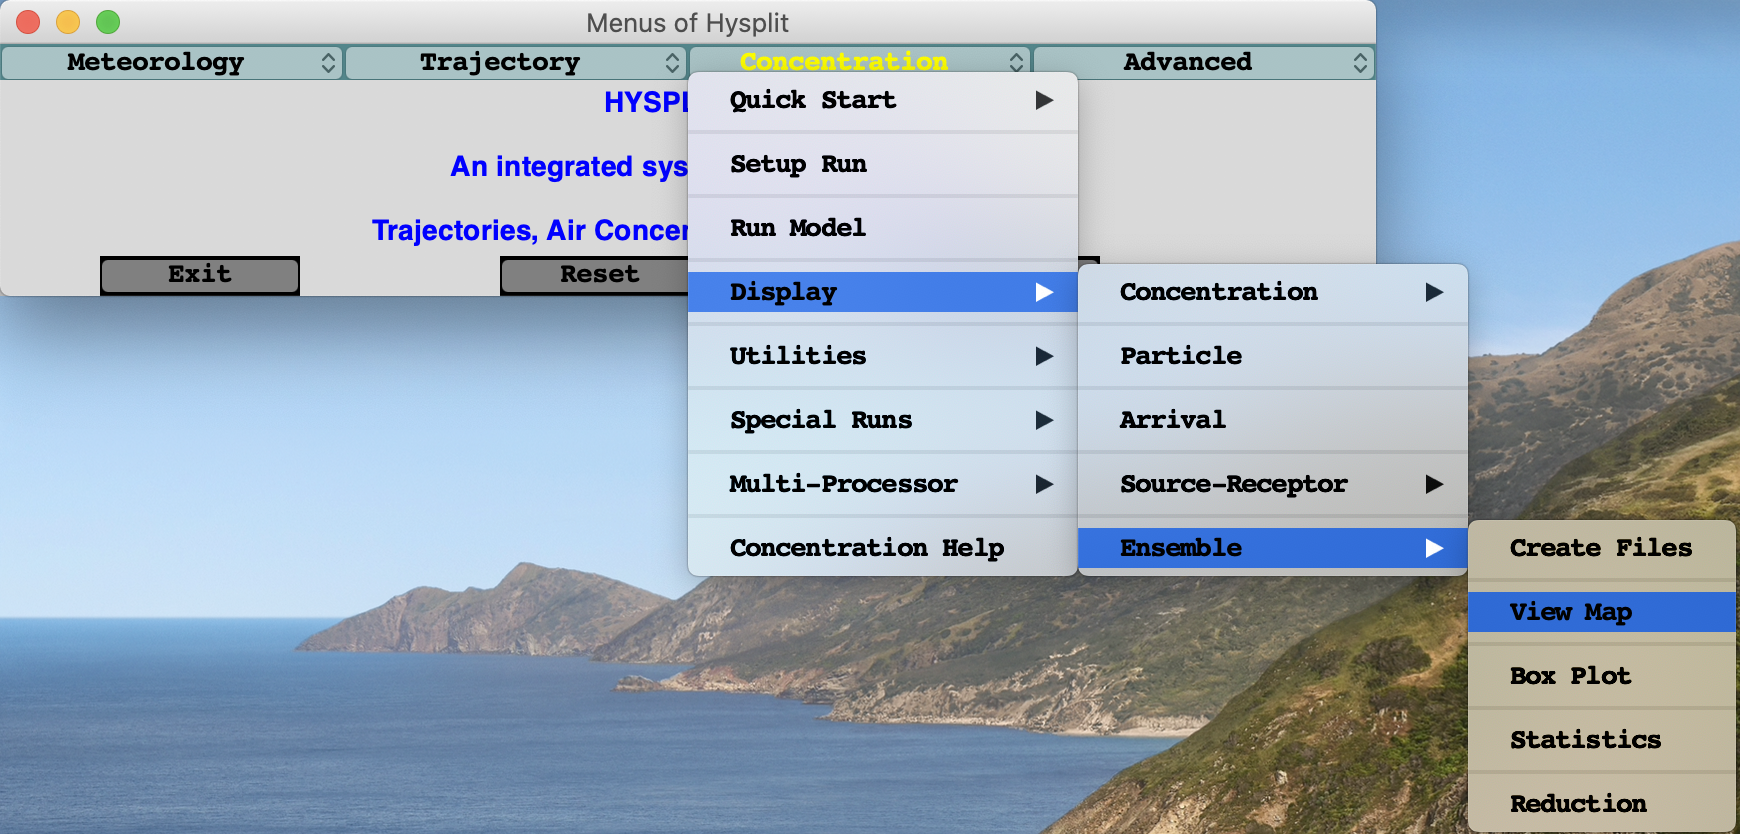
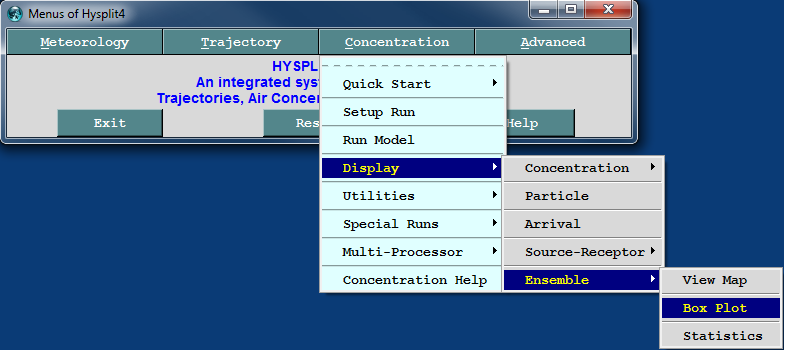
View Probability Maps
View Box Plots
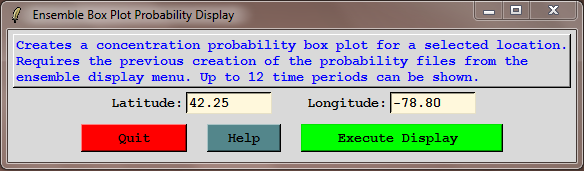
42.25 -78.80 | Little Valley NY |
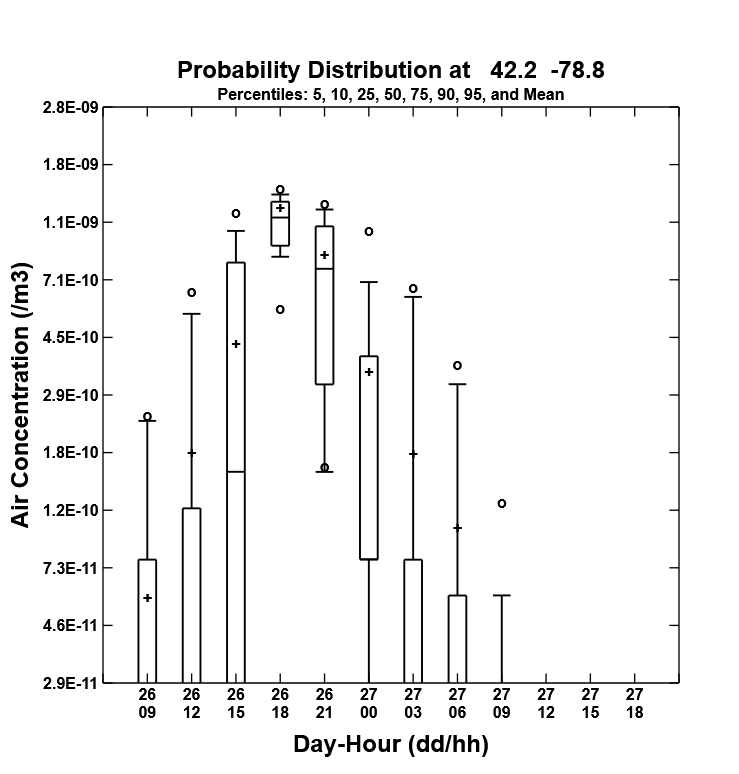
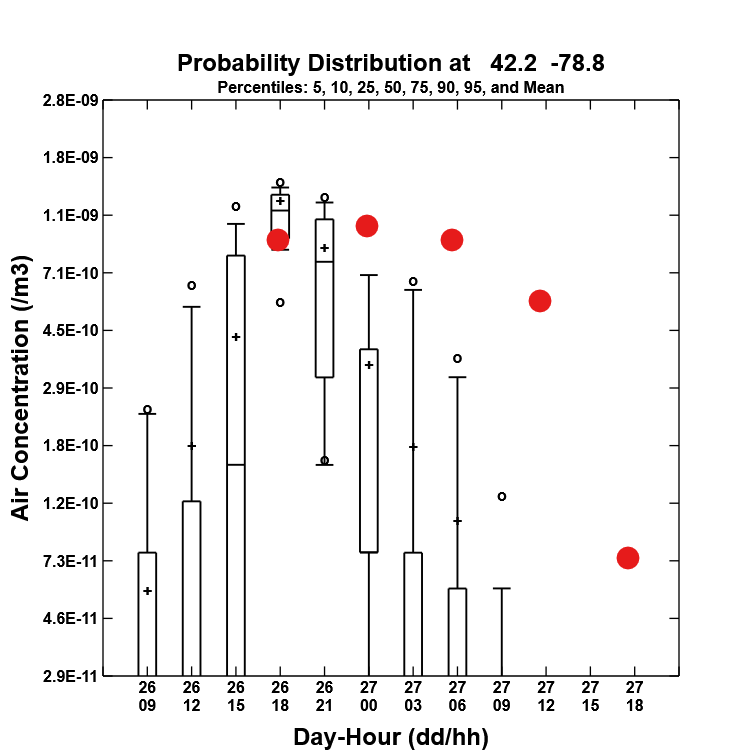
Large range at early and later times due to many members having zero values
Ensemble Grid Offsets
| RUN | DX | DY | DZ |
| 001 | +0 | +0 | +0 |
| 002 | +0 | +1 | +0 |
| 003 | +0 | -1 | +0 |
| 004 | +1 | +0 | +0 |
| 005 | +1 | +1 | +0 |
| 006 | +1 | -1 | +0 |
| 007 | -1 | +0 | +0 |
| 008 | -1 | +1 | +0 |
| 009 | -1 | -1 | +0 |
| 010 | +0 | +0 | +1 |
| 011 | +0 | +1 | +1 |
| 012 | +0 | -1 | +1 |
| 013 | +1 | +0 | +1 |
| 014 | +1 | +1 | +1 |
| 015 | +1 | -1 | +1 |
| 016 | -1 | +0 | +1 |
| 017 | -1 | +1 | +1 |
| 018 | -1 | -1 | +1 |
| 019 | +0 | +0 | -1 |
| 020 | +0 | +1 | -1 |
| 021 | +0 | -1 | -1 |
| 022 | +1 | +0 | -1 |
| 023 | +1 | +1 | -1 |
| 024 | +1 | -1 | -1 |
| 025 | -1 | +0 | -1 |
| 026 | -1 | +1 | -1 |
| 027 | -1 | -1 | -1 |