Sensitivity of Multi-Model Ensemble to Grid Size
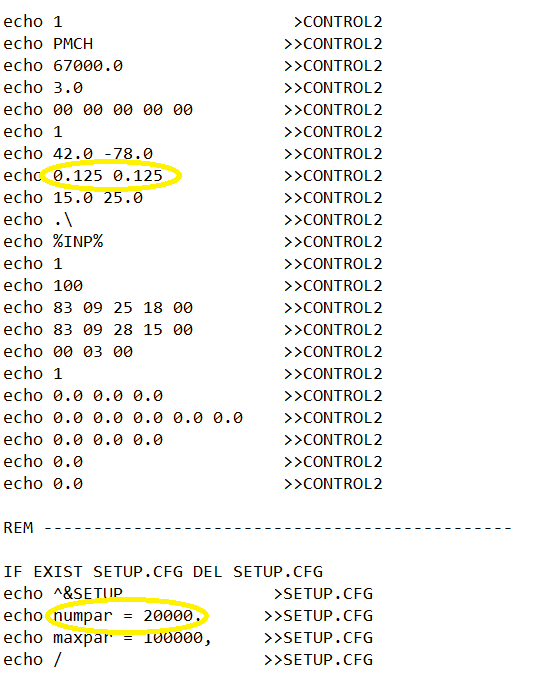
Edit ens_data.{bat|sh} to double resolution and particles
and change binary output file to hysplitx
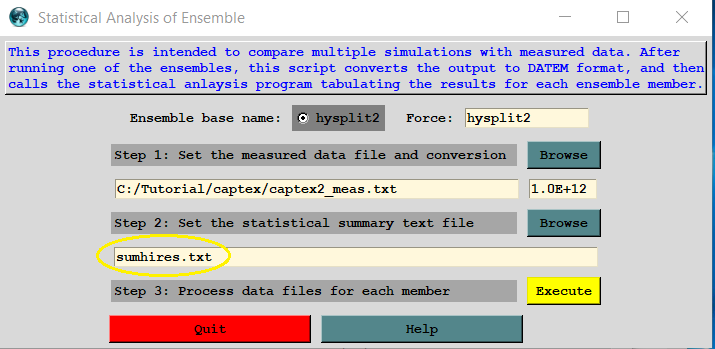
Compute statistics through the ensemble display menu
Compare ensemble mean results (top=0.25 bot=0.125)
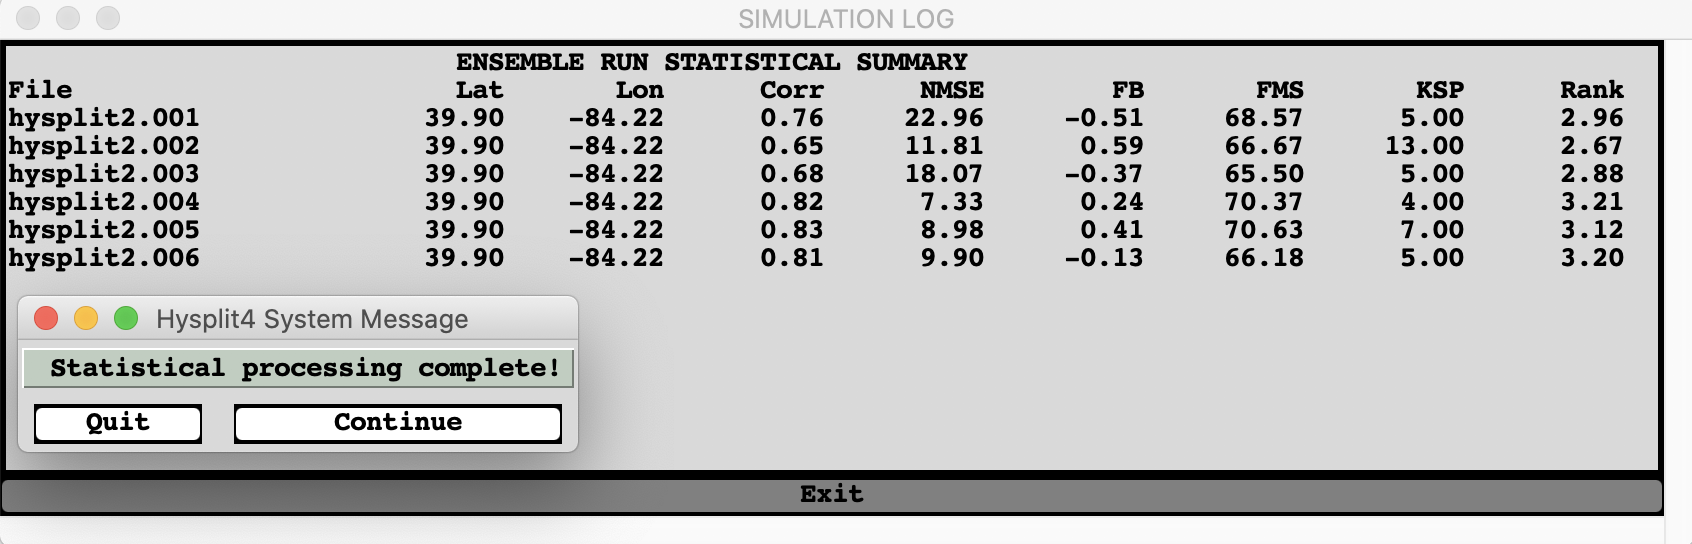
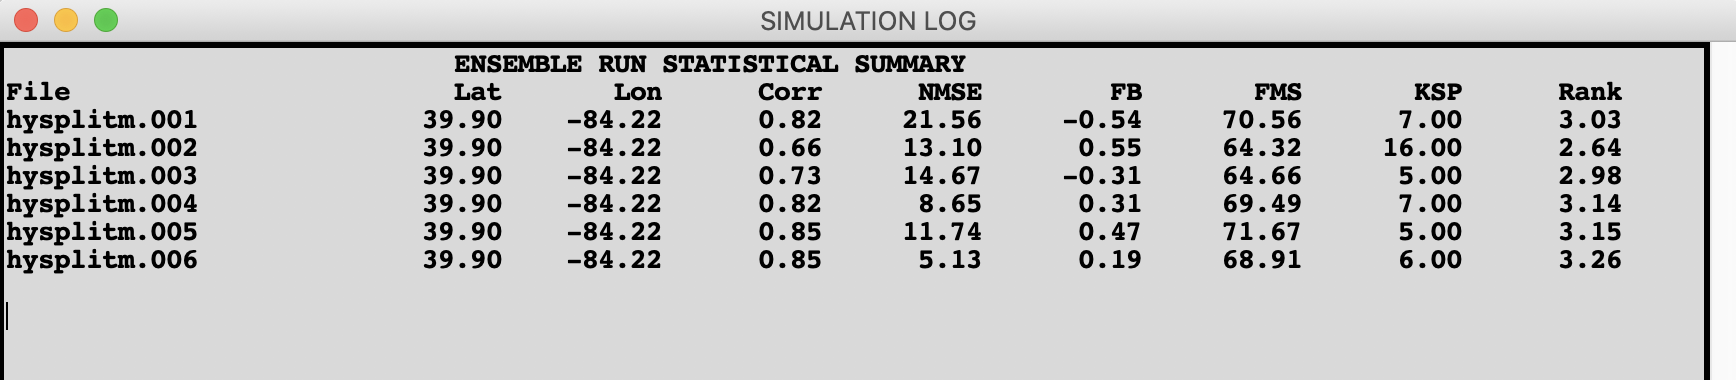
Although the results were somewhat ambiguous between different meteorological data, the ensemble mean calculations between the two concentration grid resolutions showed about the same performance.
The Best Member of the Physics Ensemble
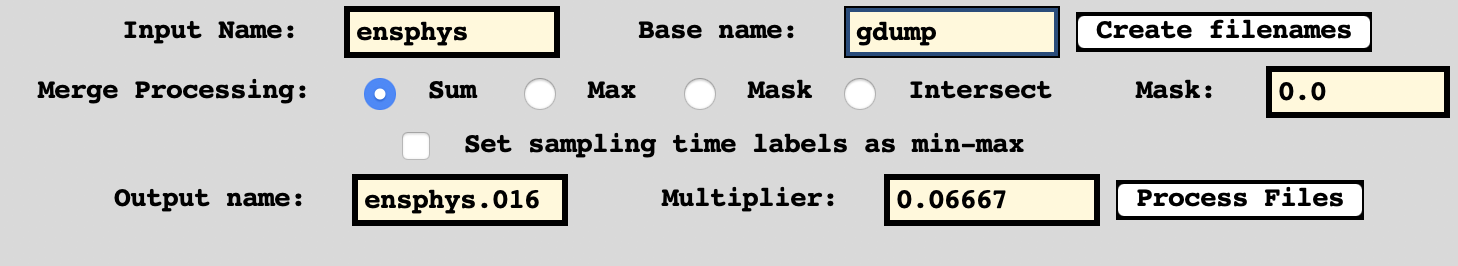
Create Physics Ensemble Mean as member ensphys.016
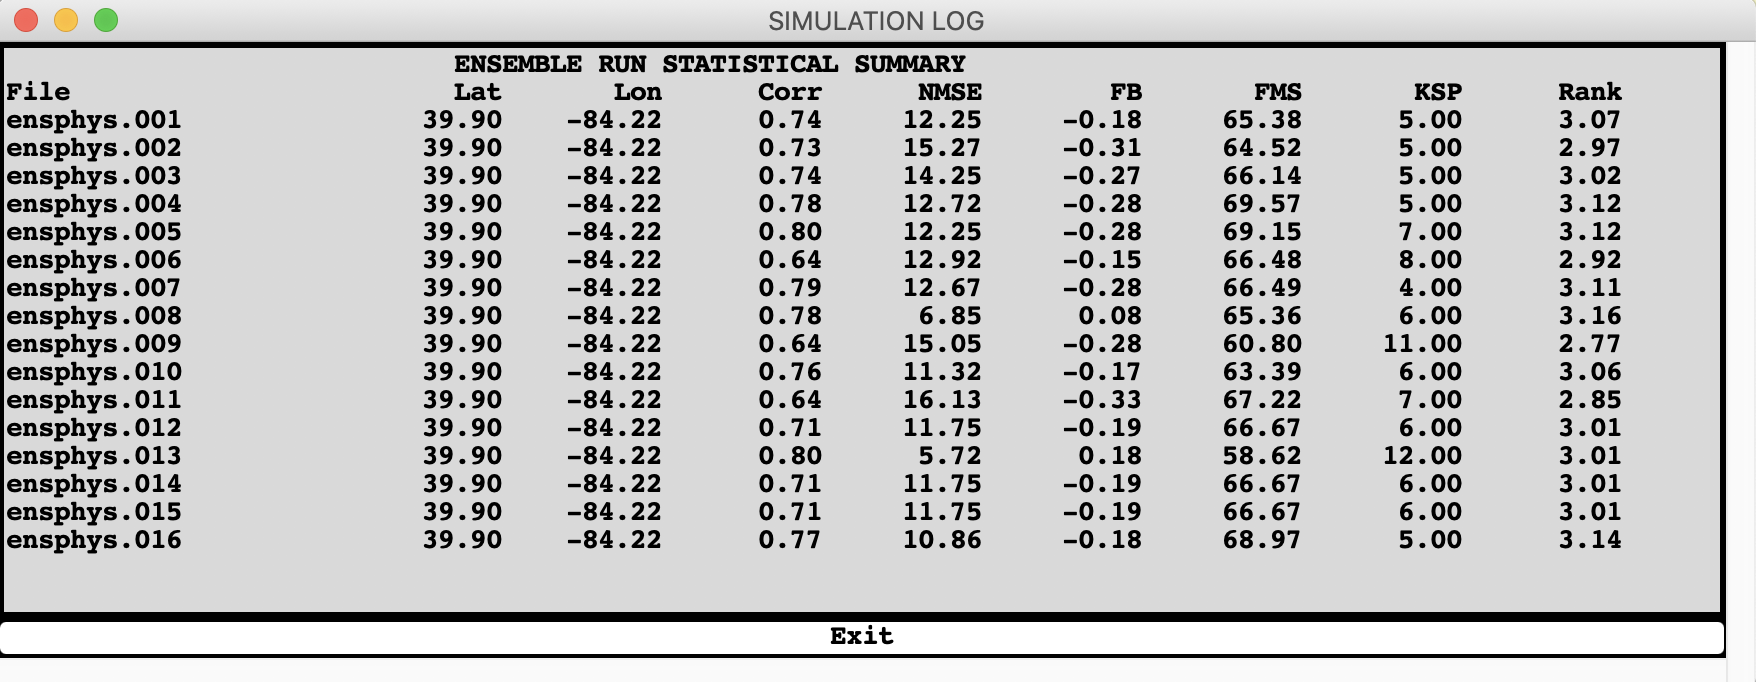
Create the Summary Statistics
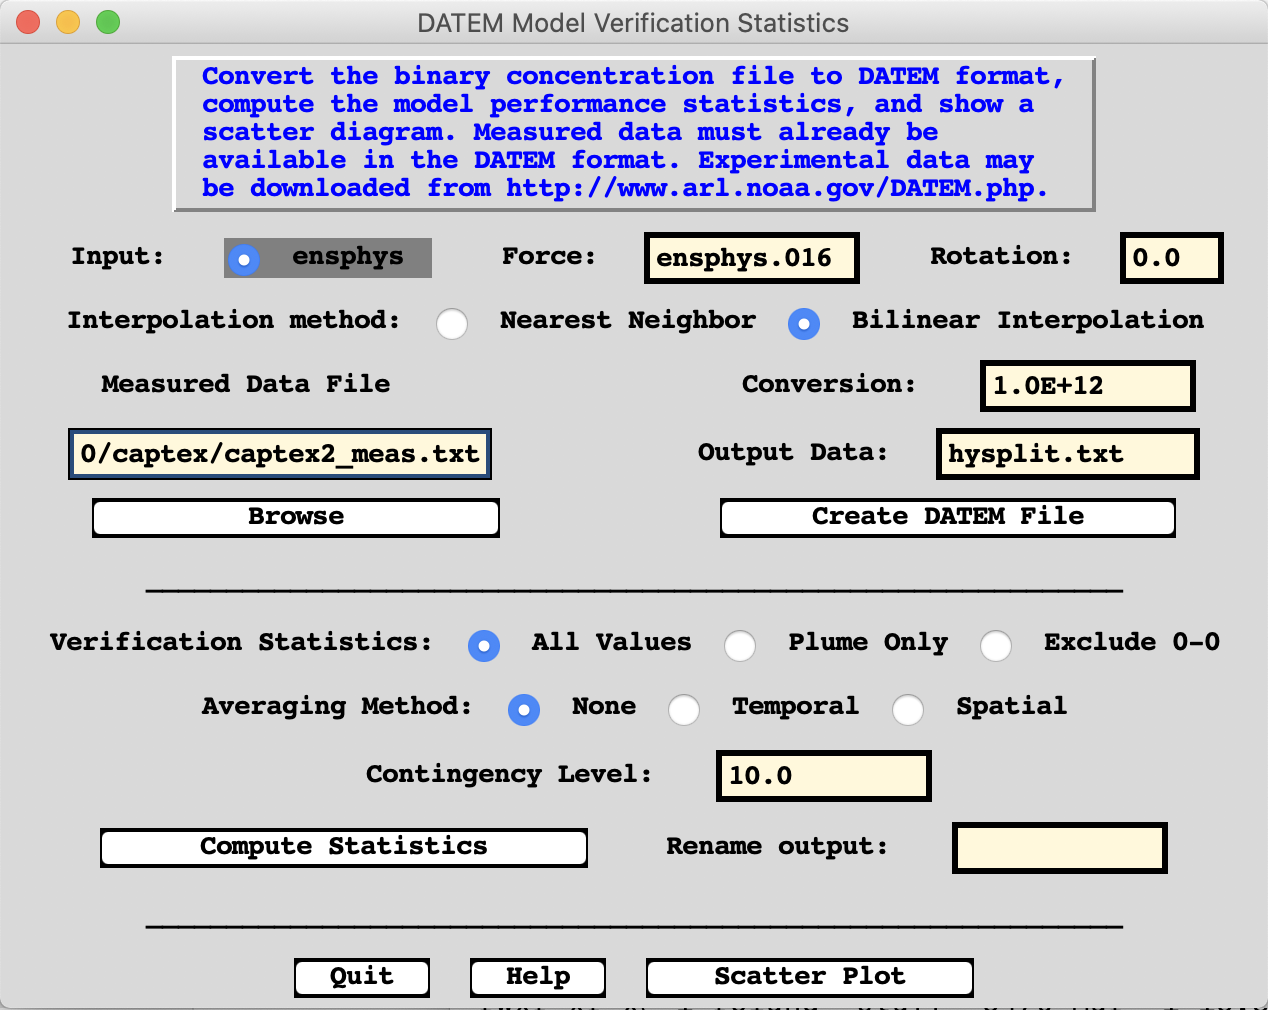
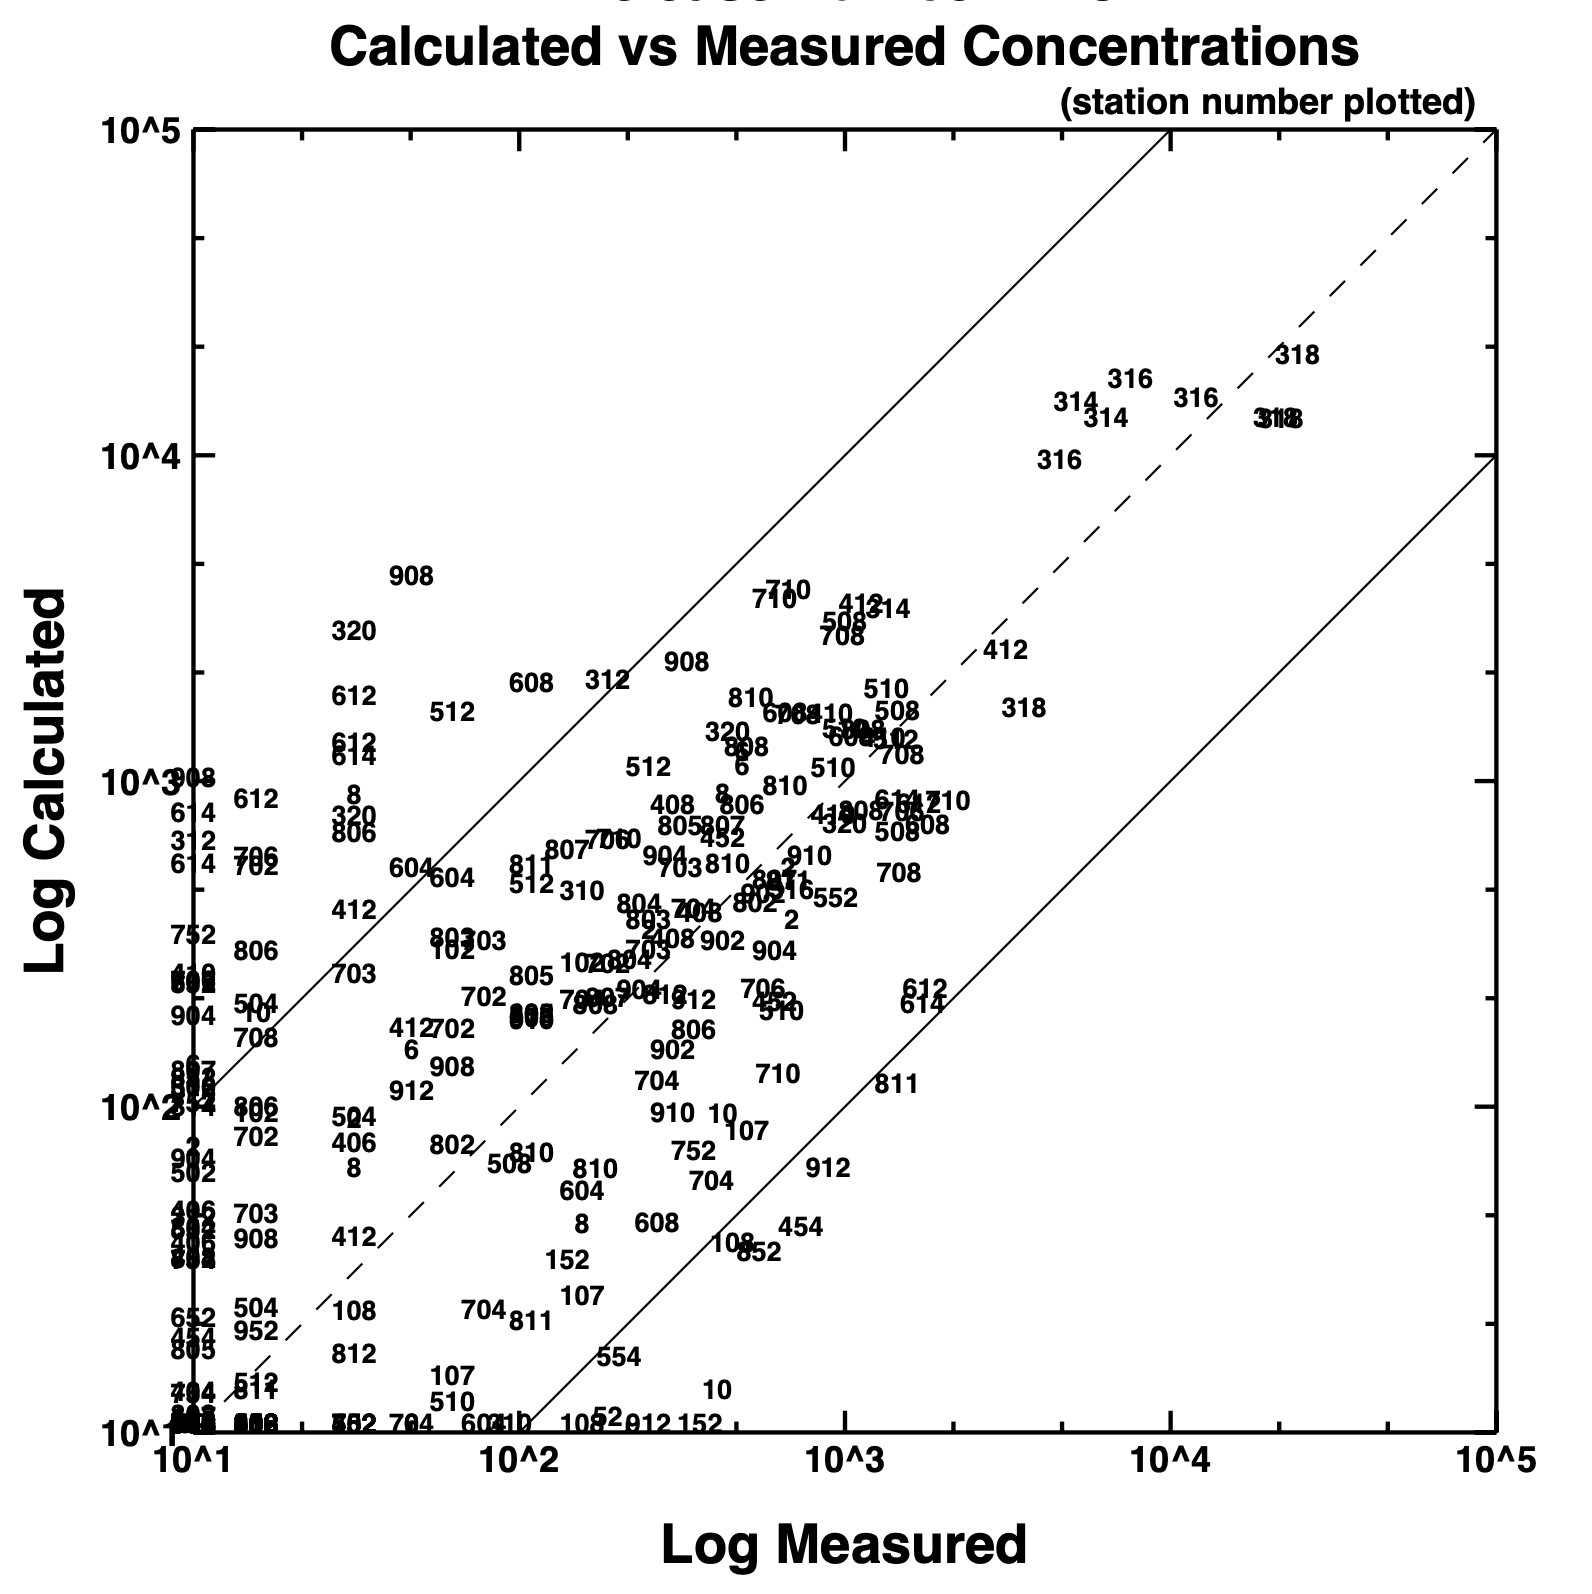
Compute Scatter Diagram of Ensemble Mean
Too broad a conclusion should not be inferred because the physics ensemble calculations were only a subset (26th 06Z to 28th 15Z) of the entire experimental period and too few particles were released in this example.