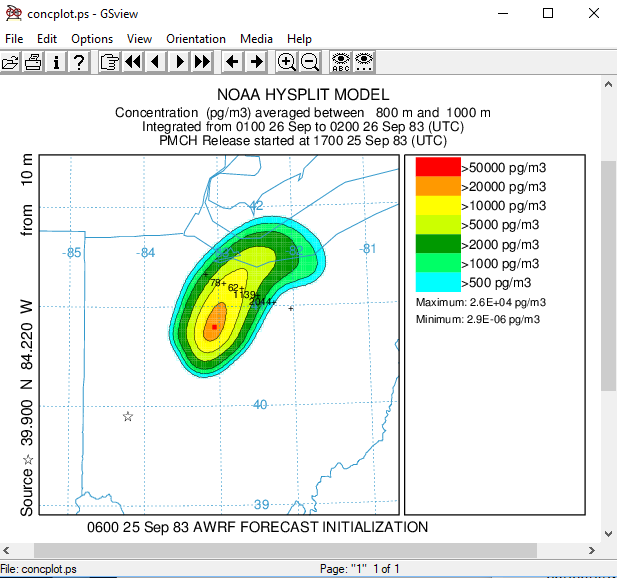
The earlier aircraft pass was approximately along the same sampling path and the calculation results show that the main plume (highest concentrations) has not yet reached the sampling line. The model results suggest that over the next two hours the plume position will shift to the east and the northeast along the plume axis.
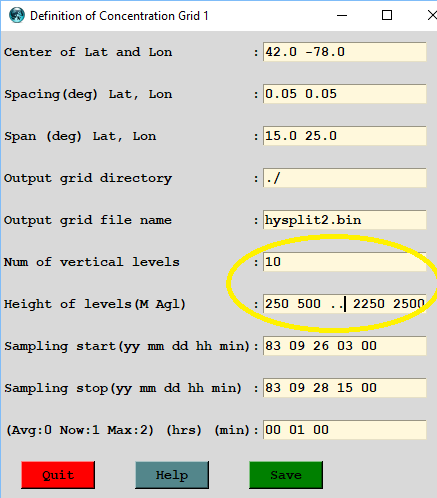
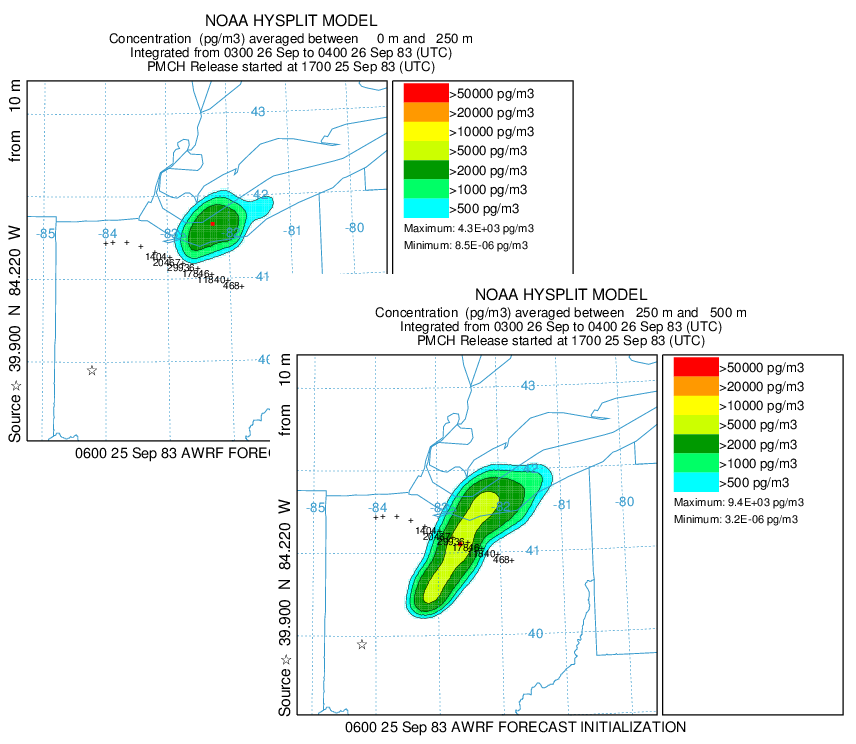
The plume display by level shows the faster and more clockwise transport at the higher elevations. The lowest level (<250 m MSL) shows a pattern inconsistent with the other levels because the average terrain in that region is 300 m MSL and therefore no plume is calculated in the 0-250 m MSL layer until the terrain drops below 250 m which is closer to Lake Erie.