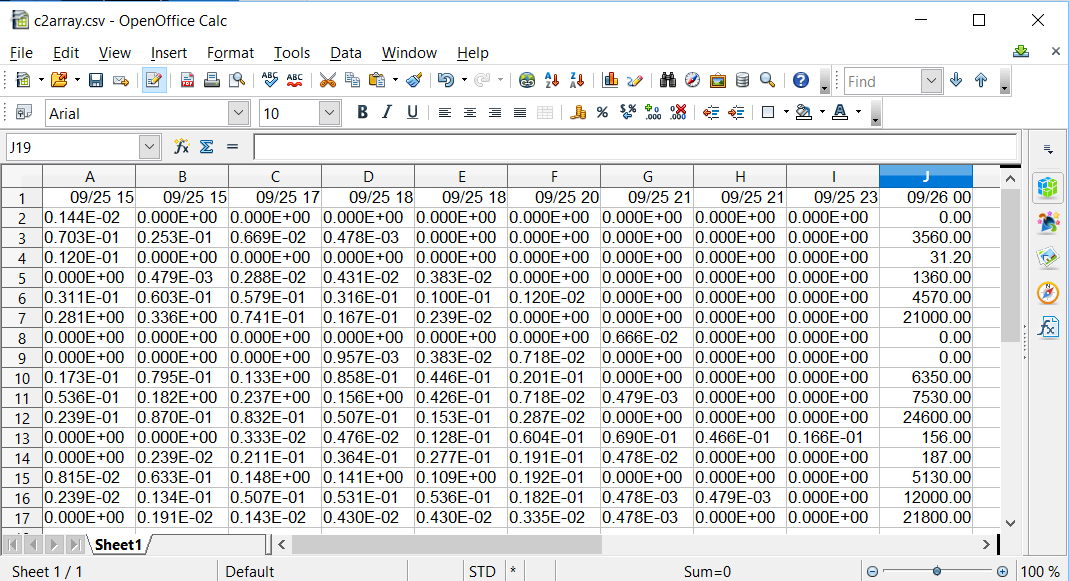
Time Variation of Emissions using the Ratio Method
Use the existing coefficient matrix with the 9 emission times
- Under each release time define the slope function
- Let measured data (last column) become Y
- Let model prediction (release time column) become X
- Use $Column$Row definition to fix the measured data column
- Copy slope equation to the bottom of each release column
- Show slope (M/C) solution foe each release time
Emission results for hours 15 to 23 ...
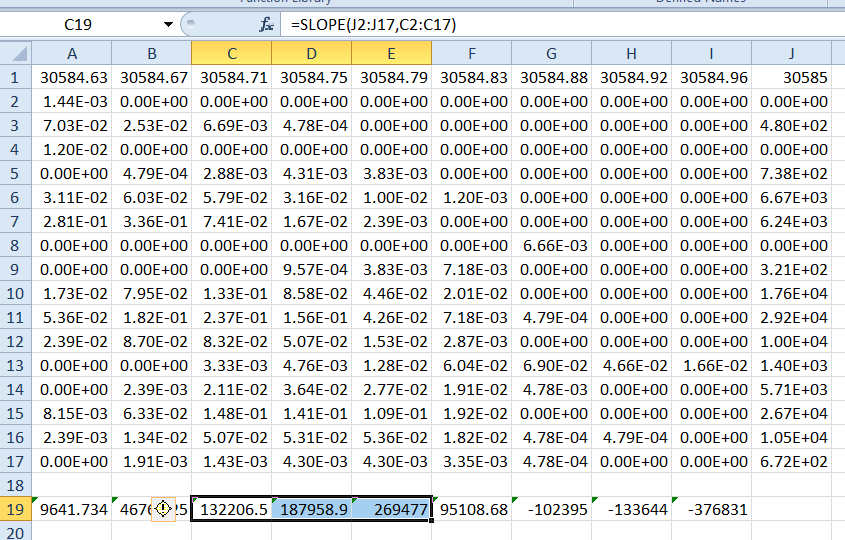
The highest emission rates are for hours 17, 18, and 19, although they
are more than twice the actual emissions (67,000), correspond with the times
of the known emissions.