Exercise #16 |
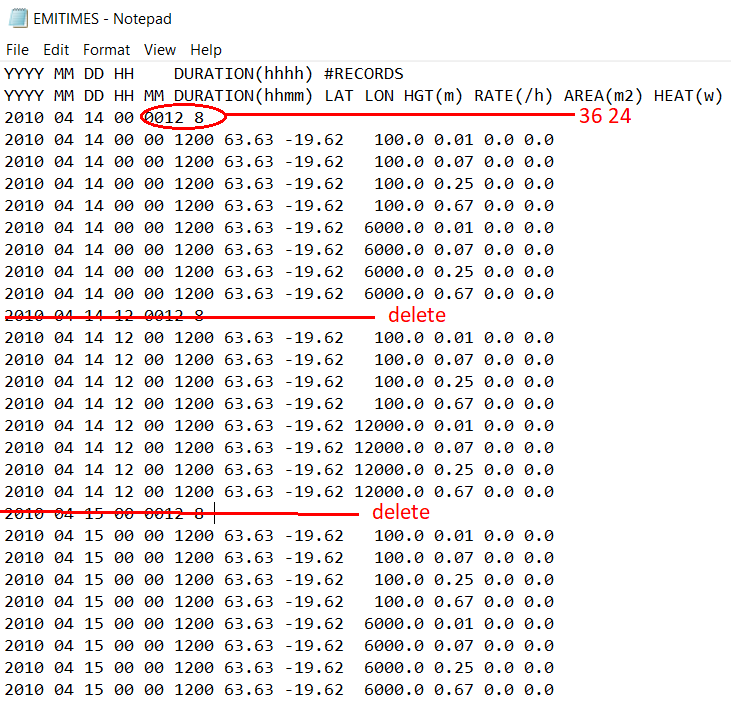
Editing an EMITIMES File
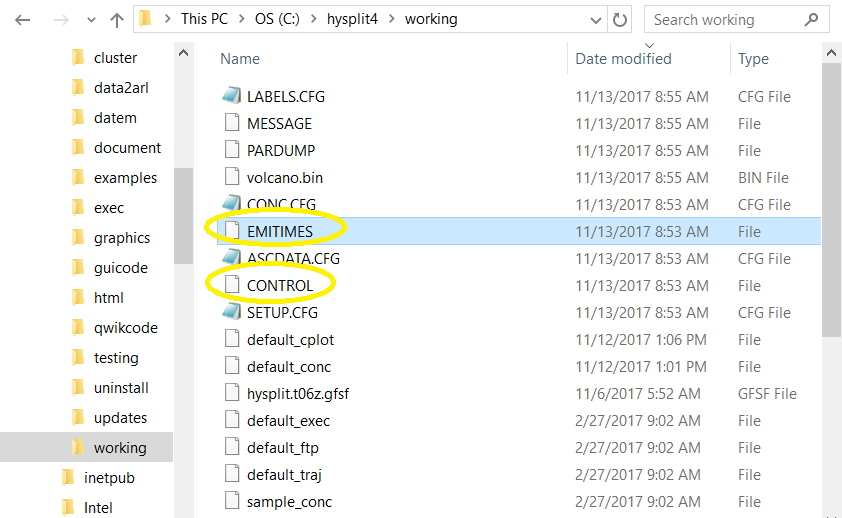
Start with the CONTROL and EMITIMES created in the previous example
Edit EMITIMES to create one emission cycle
(with 24 data records)
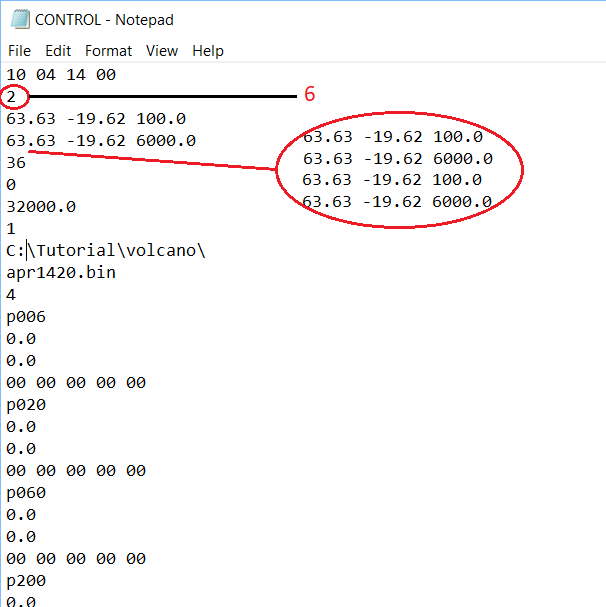
Edit CONTROL to match EMITIMES
(6 sources = 24 records / 4 pollutants)
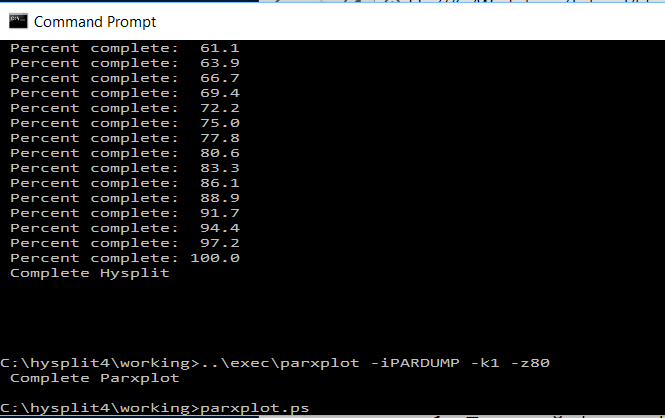
Run HYSPLIT
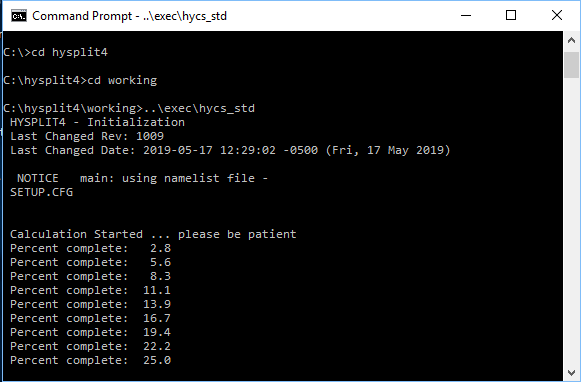
and particle plot
The three emission cycle simulation showed 17187 particles at the end of 36 hours while the single emission cycle simulation showed only 7118 particles because in the name list file NUMPAR was set to 5000 particles per emission cycle.
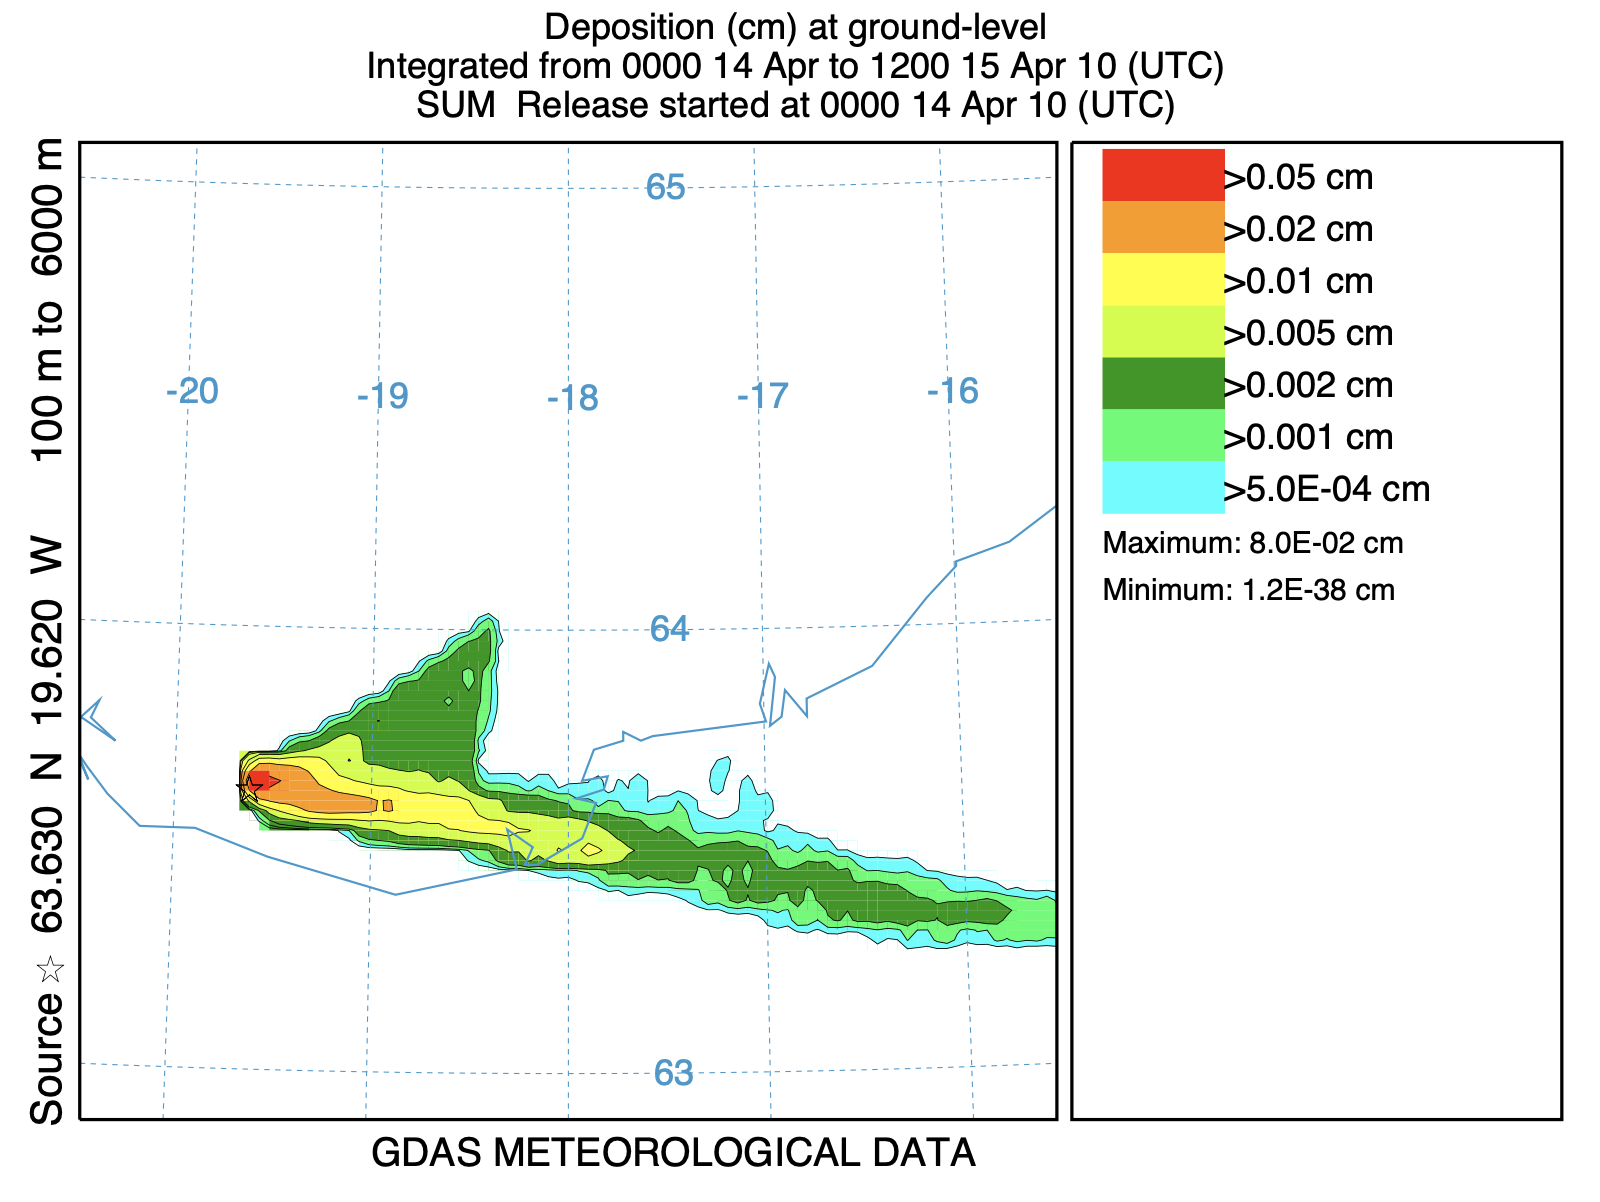
Computing the Total Deposition
Add a deposition layer and finer grid
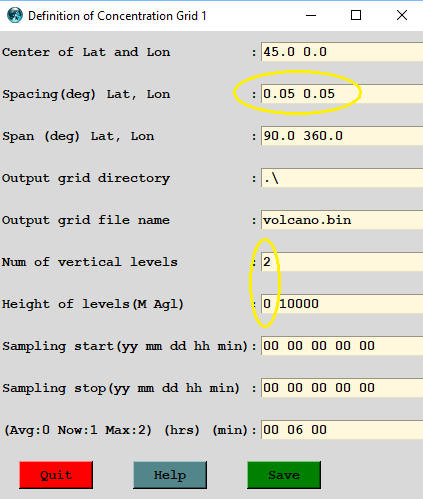
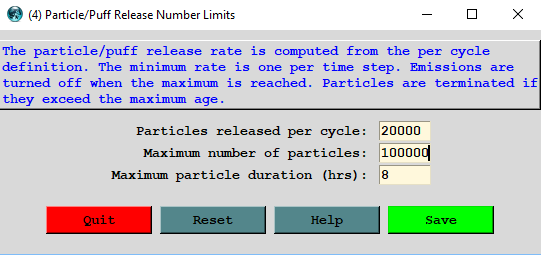
Use more particles, shorten duration
Determine conversion ug/m2 to cm
| Depth (cm) = | Density | Deposition | m2 to cm2 | ug to g |
| 10^6 cm | 1 cm3/g | 10^16 ug/m2 | m2/10^4 cm3 | 1g/10^6 ug |
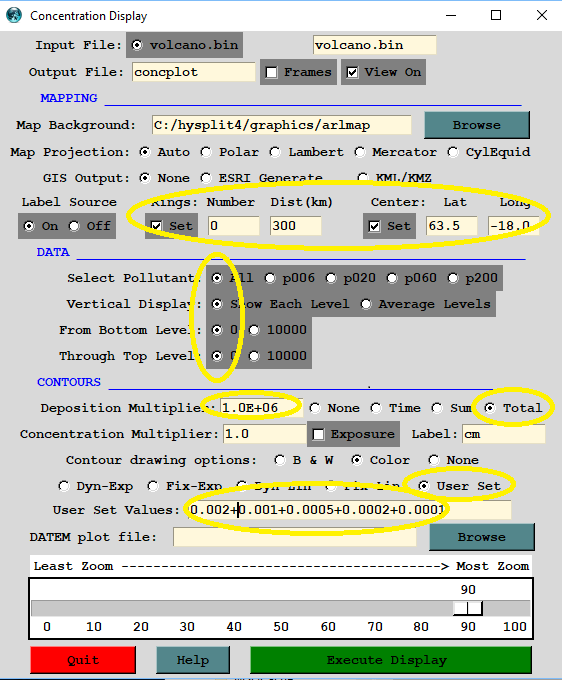
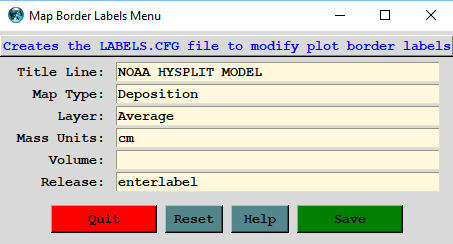
Optimize Display
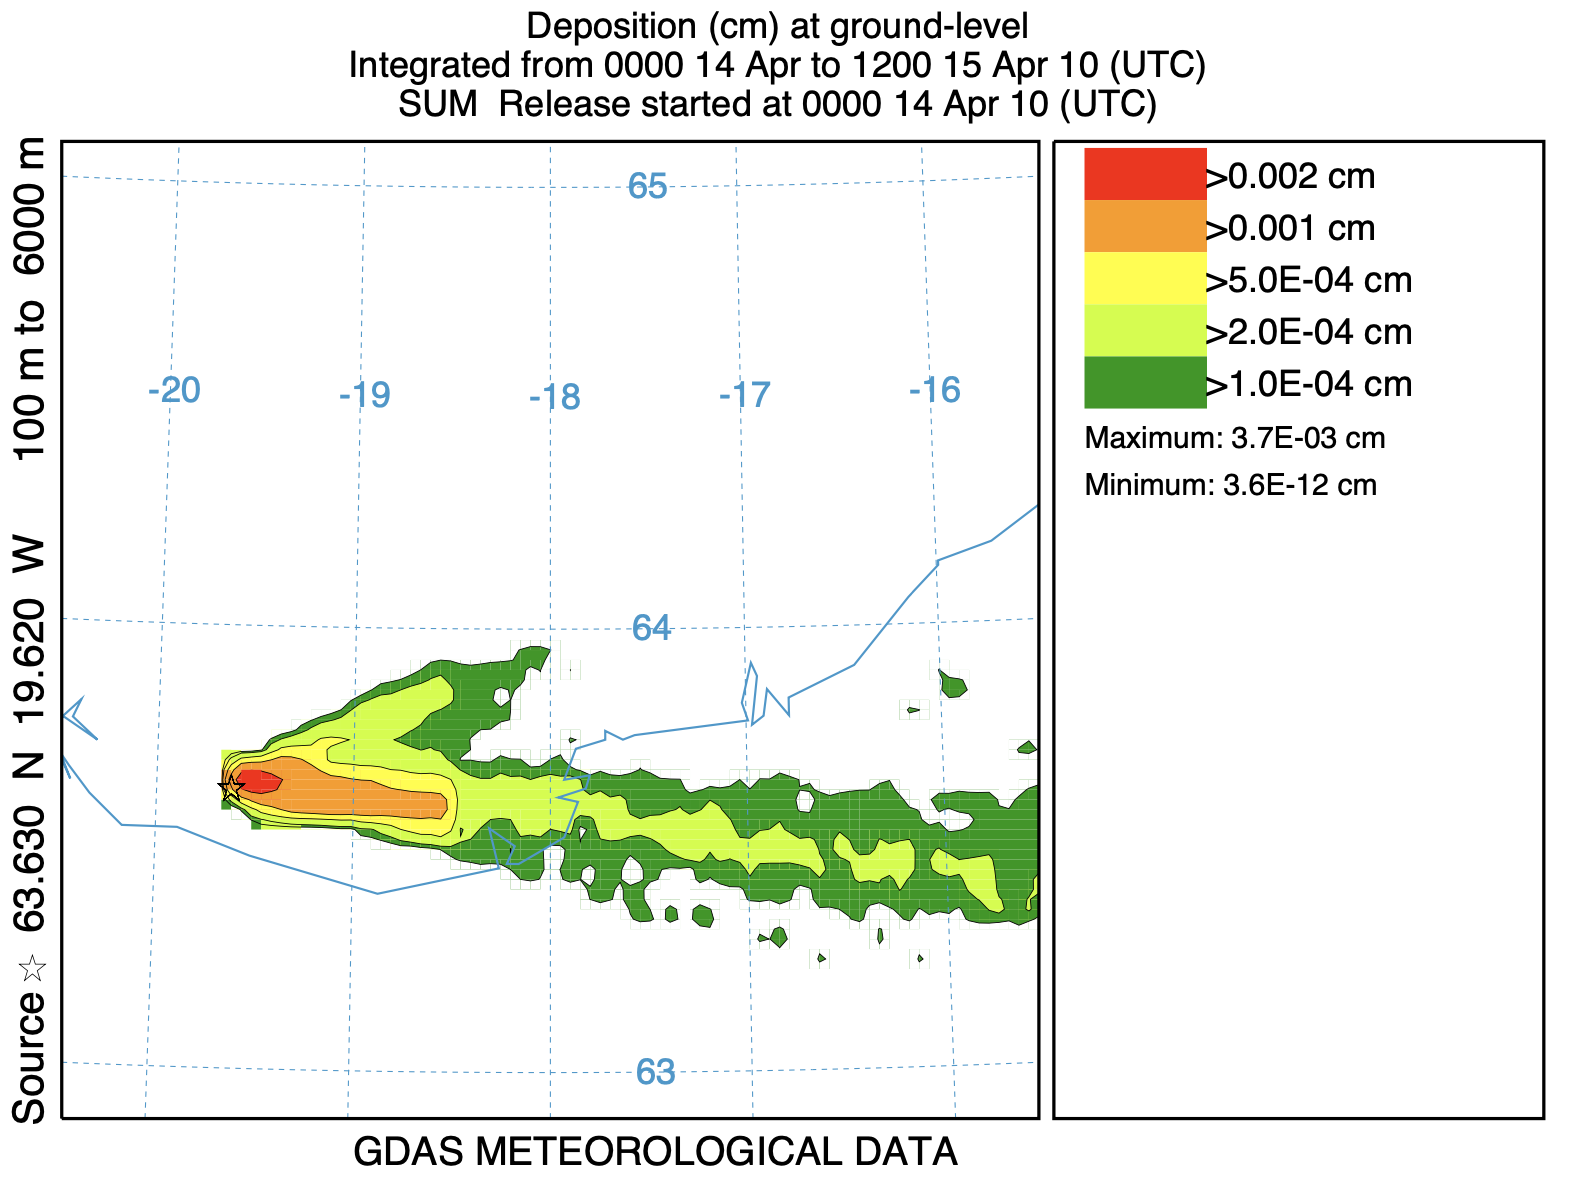
In contrast, the emission rate for the Mt. St. Helens eruption was around 1013 g/h or 1019 ug/h, 1000 times larger than the emission rate used in this example. The result would be deposition totals on the order of several cm.
Total Deposition with 10x Larger Particles
Stokes Settling
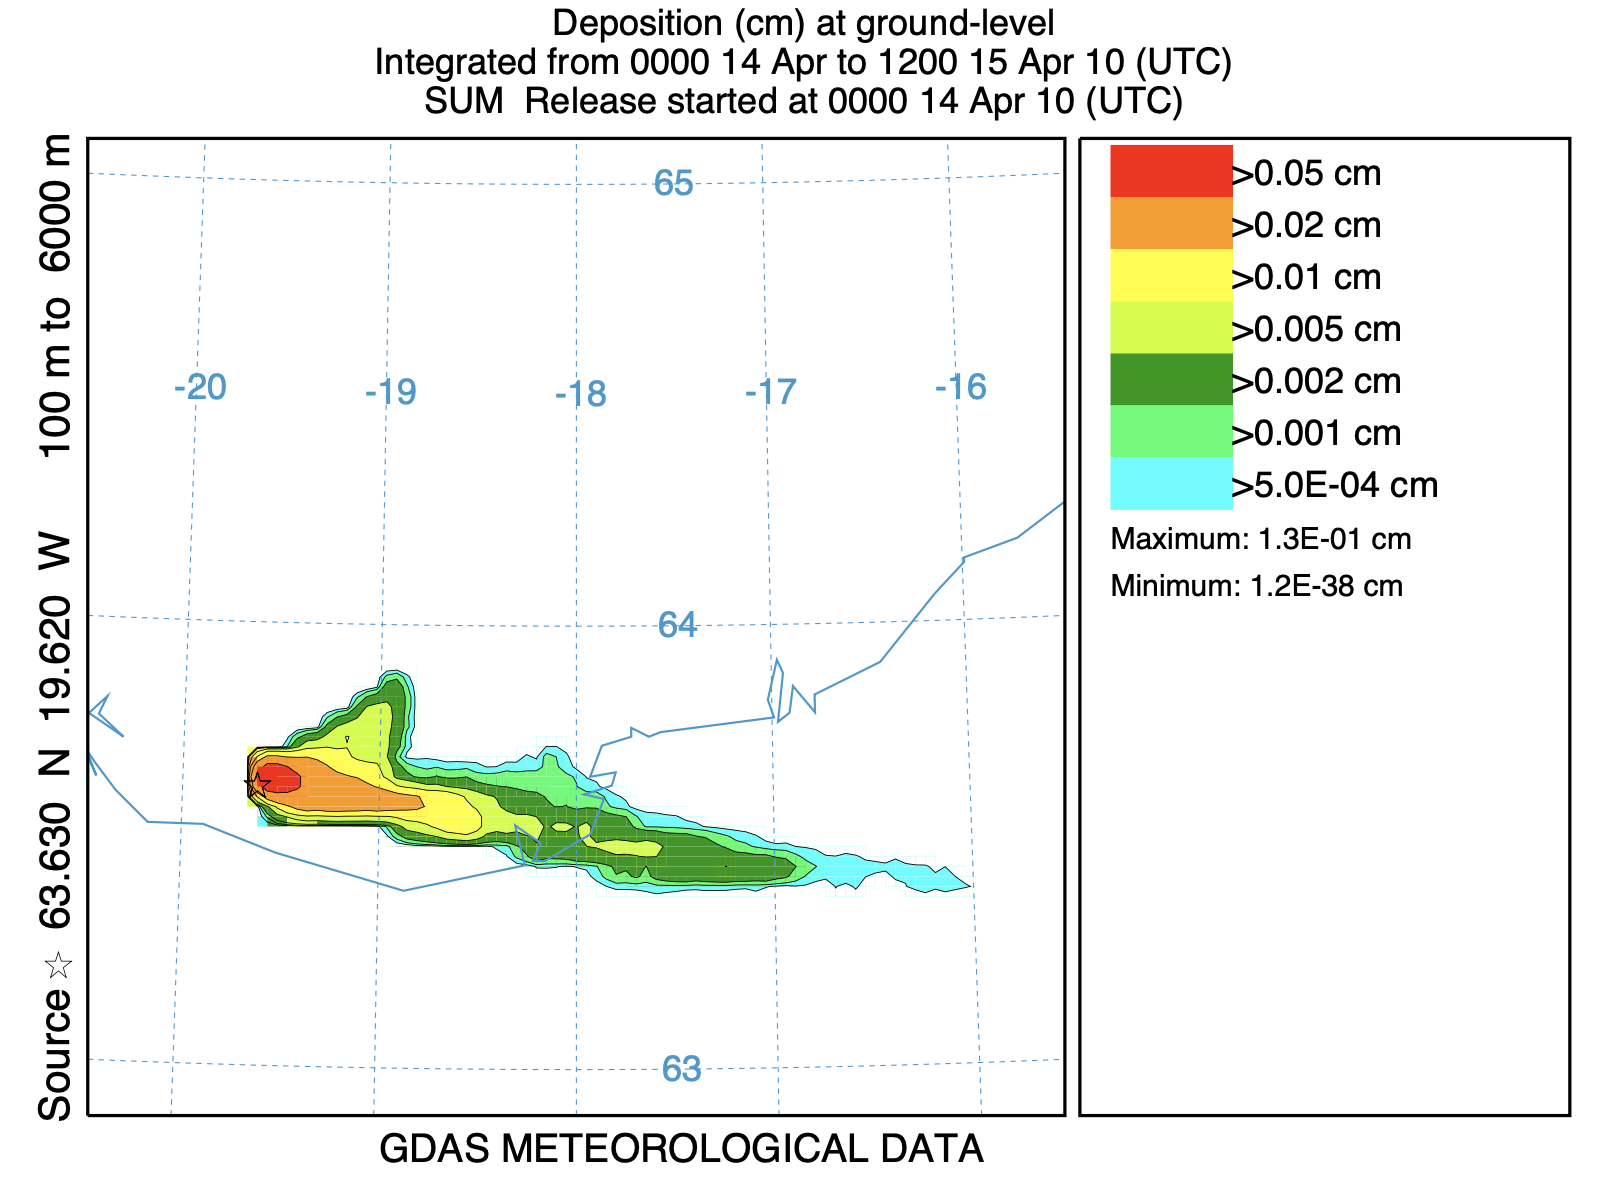
Ganser Settling (Shape = -1.0)