Exercise #13 |
Estimate Emissions from Unknown Location
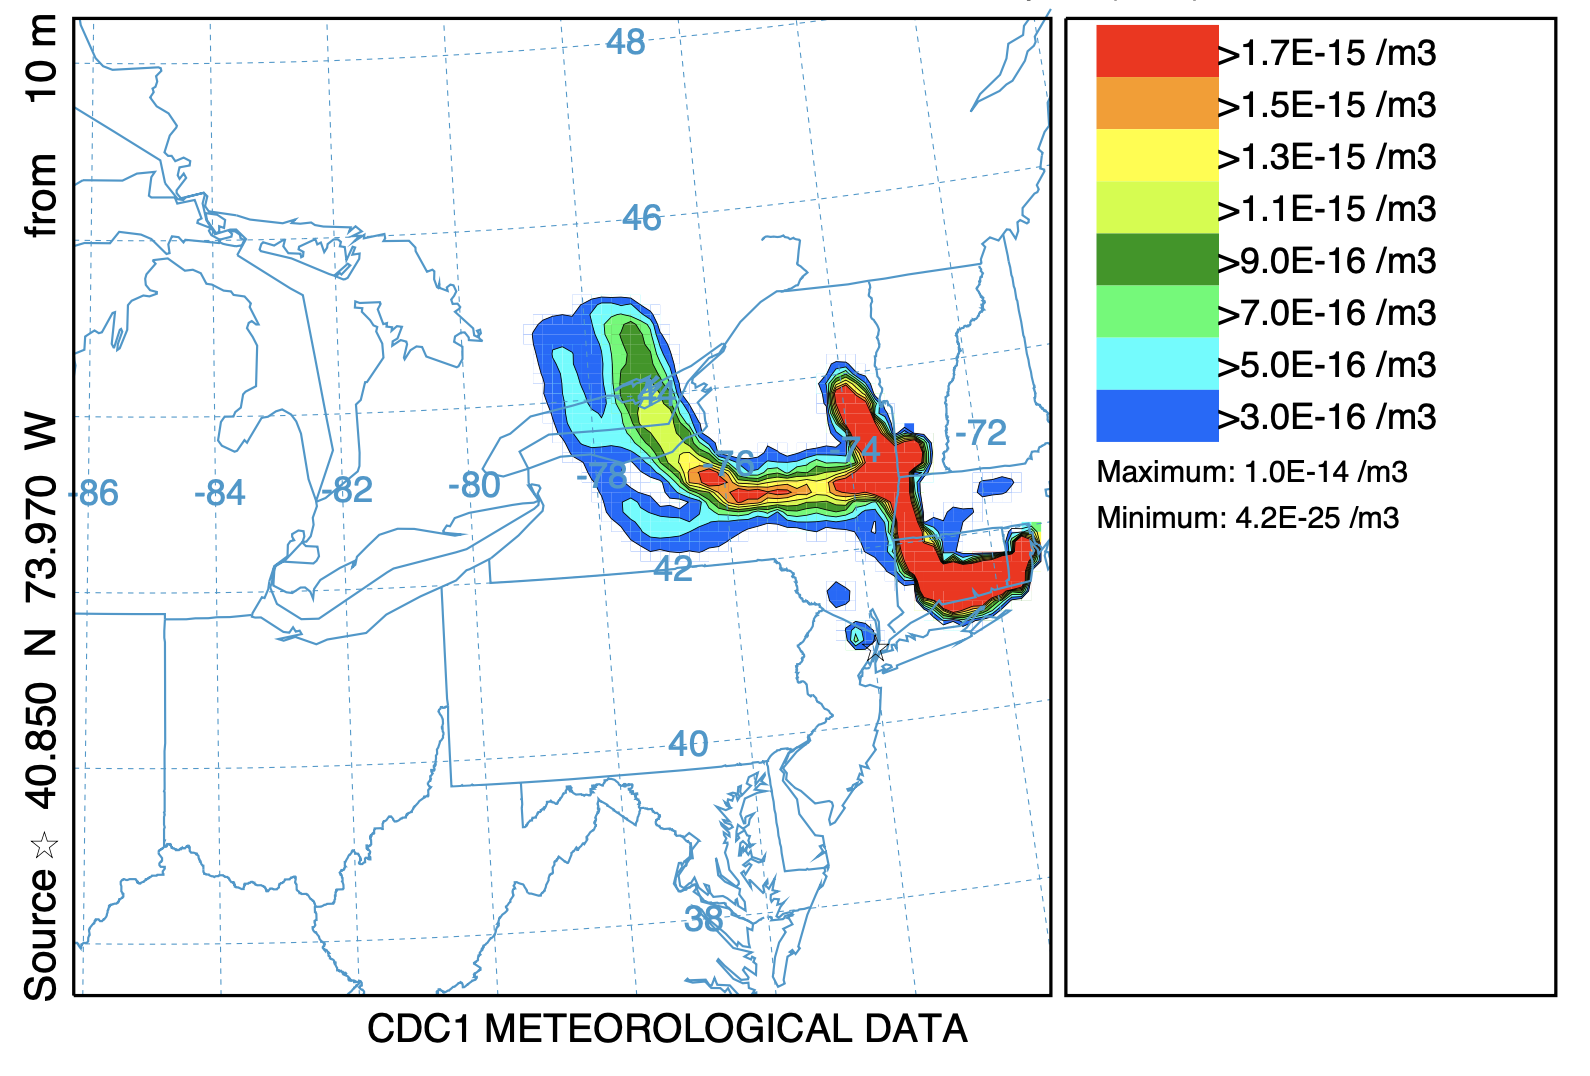
Large N-S gradient near 43N 75W
Time Variation of Emissions using the Ratio Method
Use the existing coefficient matrix with the 5 emission periods
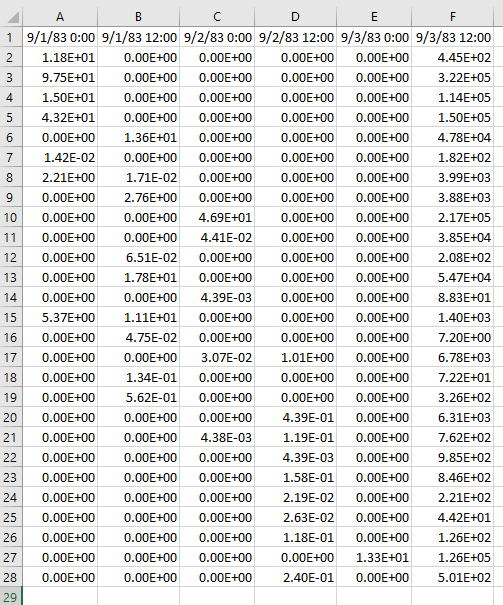
- Under each release time define the slope function
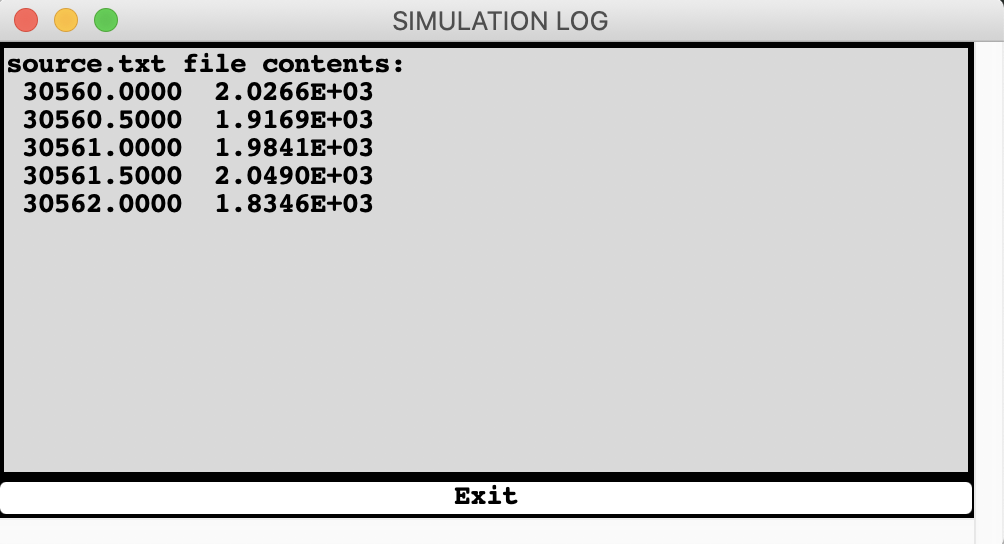
- Let measured data (last column) become Y
- Let model prediction (release time column) become X
- Use $Column$Row definition to fix the measured data column
- Copy slope equation to the bottom of each release column
- Show slope (M/C) solution for each release time
Emission results for 0100 0112 0200 0212 0300
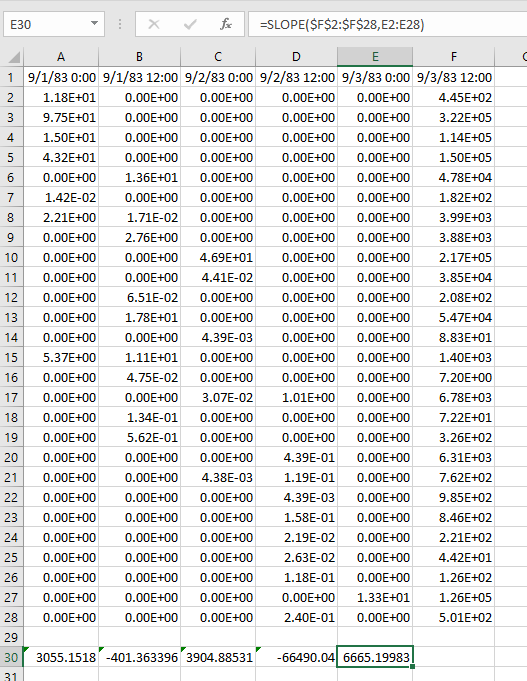
Positive emission rates are obtained only for the 1st, 3rd, and 5th periods. Solutions for individual time periods are not as good as those that consider all the data.
The Effect of Reducing Model Error
Concentration grid resolution: 0.05
Particle number: 50,000
SVD | Cost function |
 |  |
It seems that the Cost function solution performed better when there was more model error!