Exercise #12 |
Sensitivity of Multi-Model Ensemble to Grid Size
Edit ens_data.{bat|sh} to double resolution and particles
and change binary output file to hysplitx
Compute statistics through the ensemble display menu
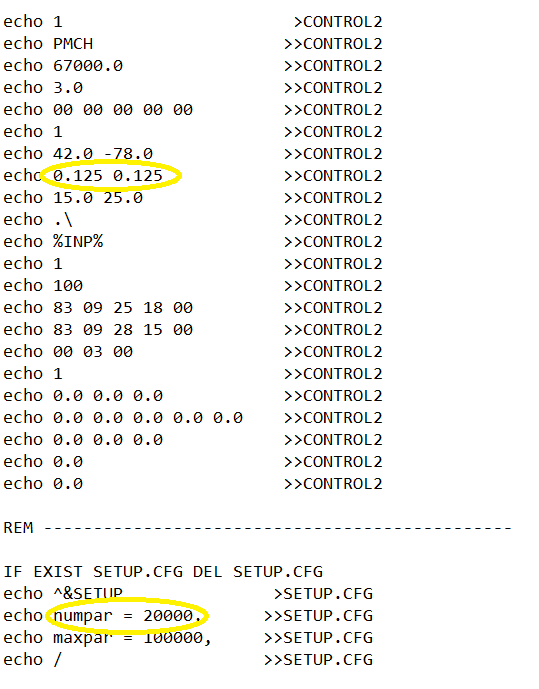
Compare ensemble mean results (top=0.25 bot=0.125)
Although the results were somewhat ambiguous between different meteorological data, the ensemble mean calculations between the two concentration grid resolutions showed about the same performance.
The Best Member of the Physics Ensemble
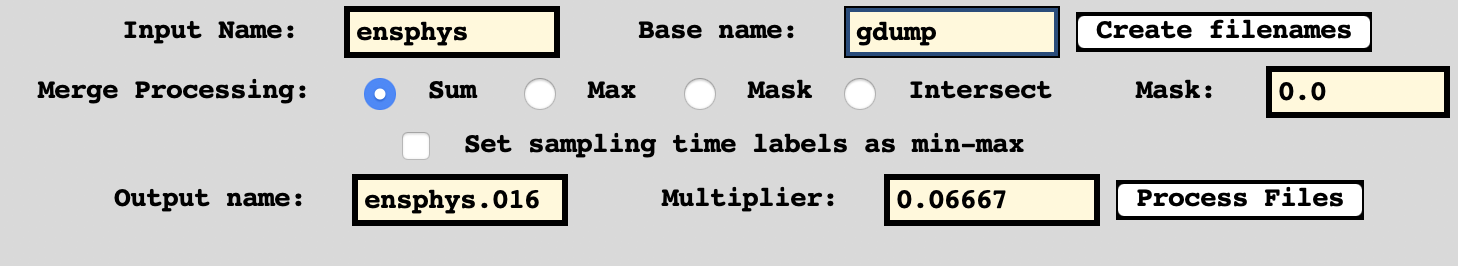
Create Physics Ensemble Mean as member ensphys.016
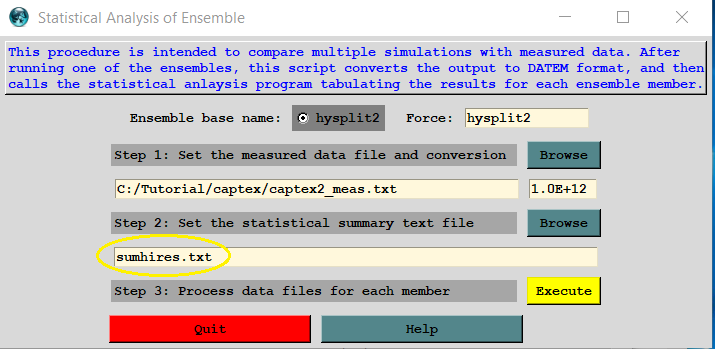
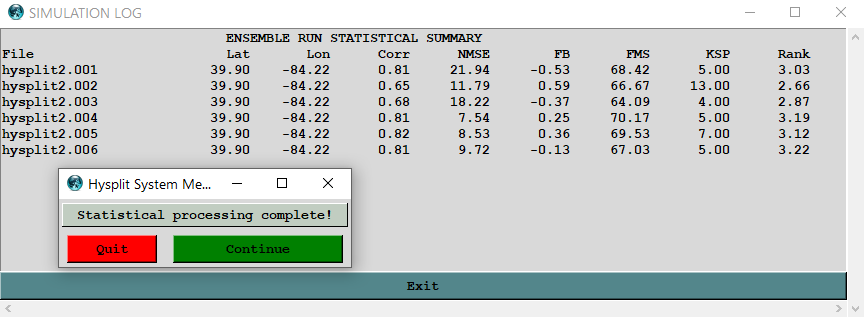
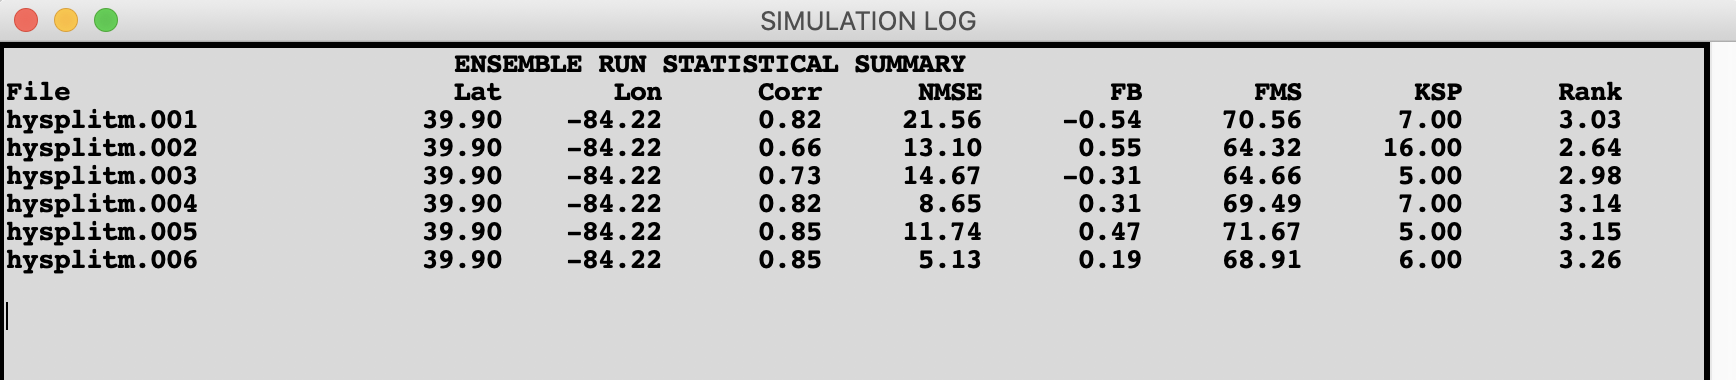
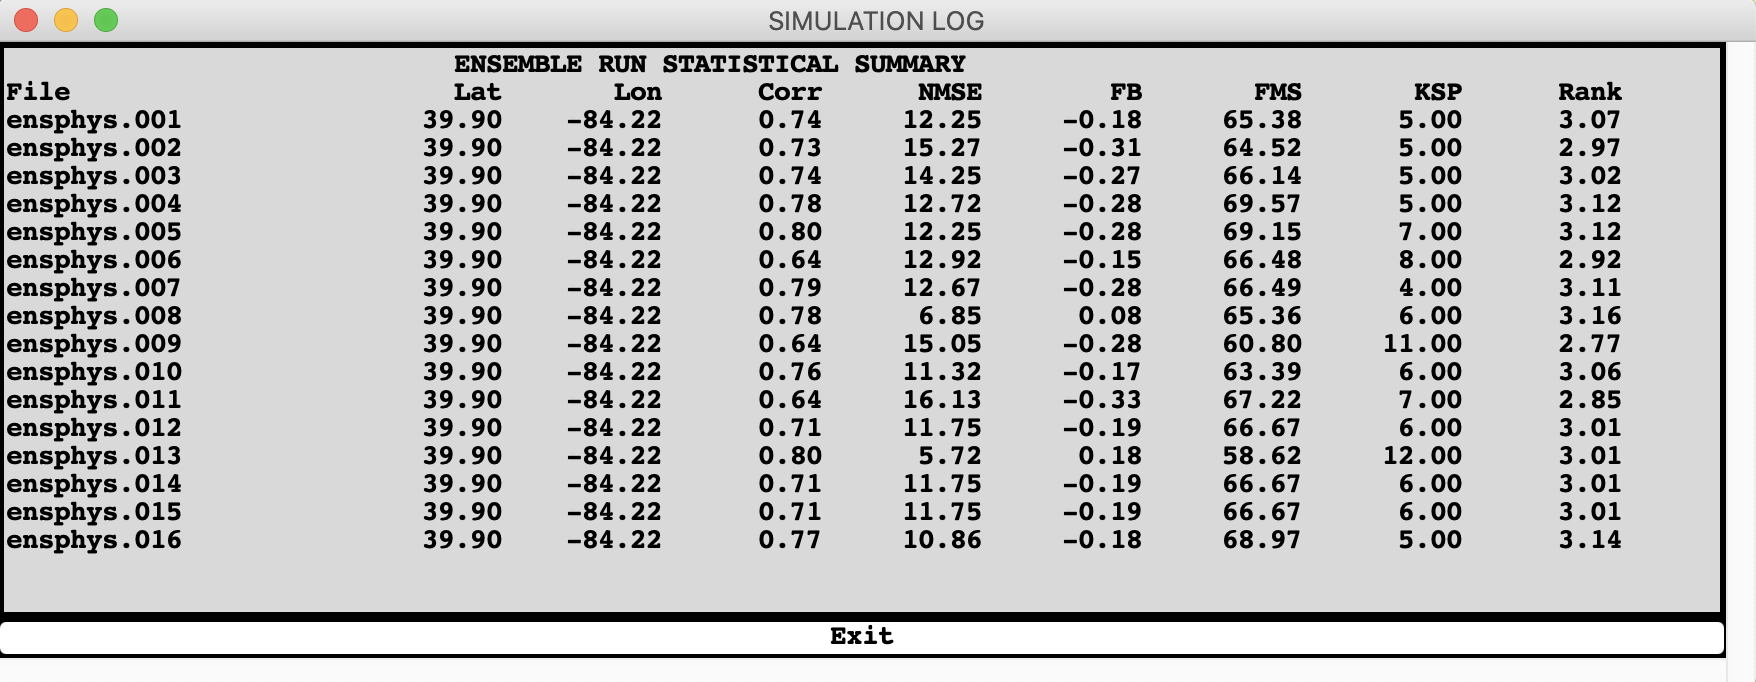
Create the Summary Statistics
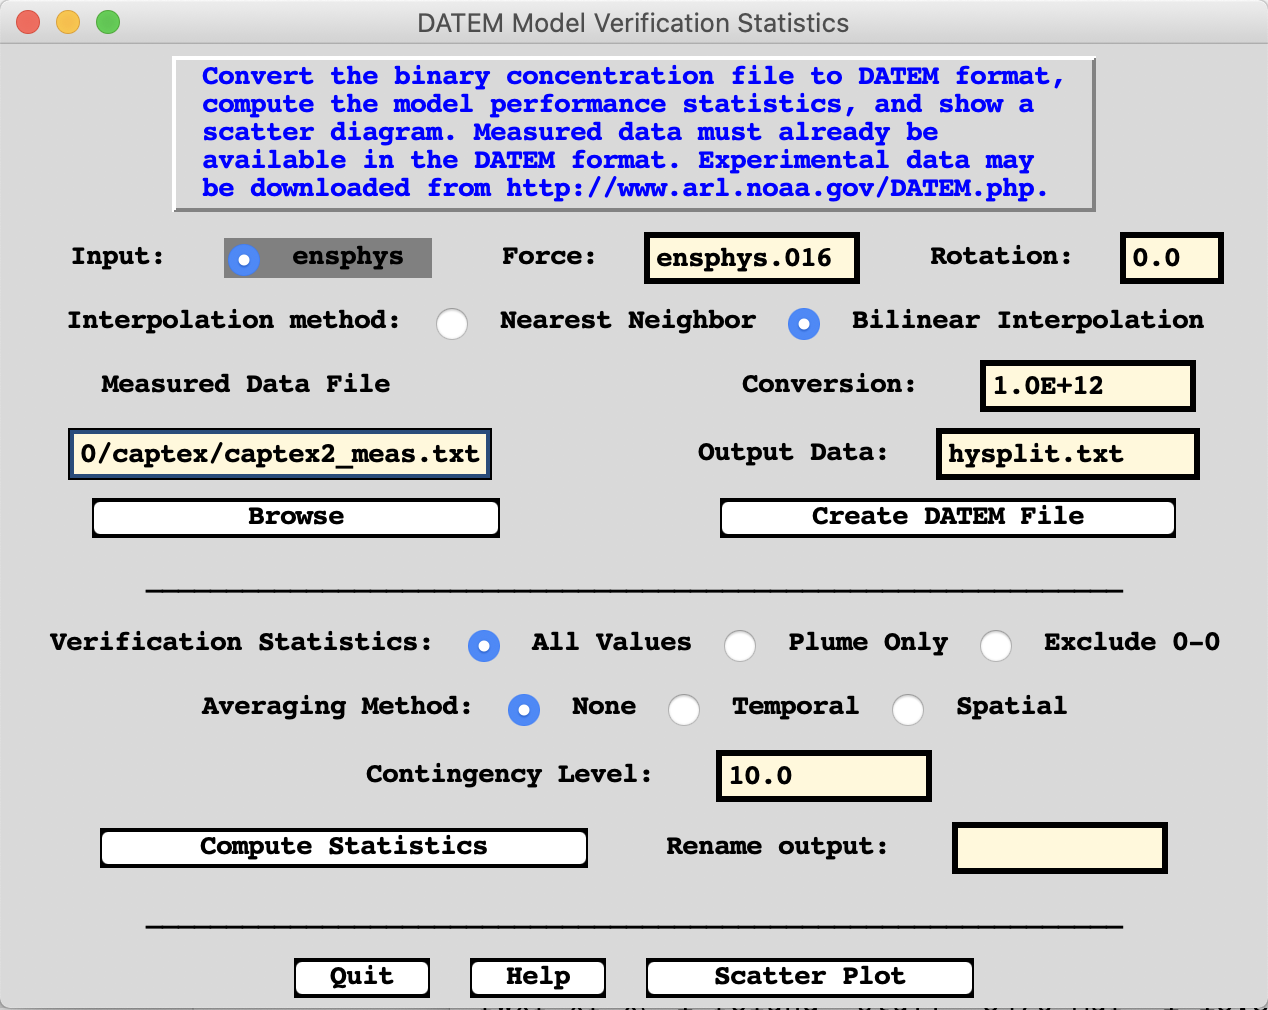
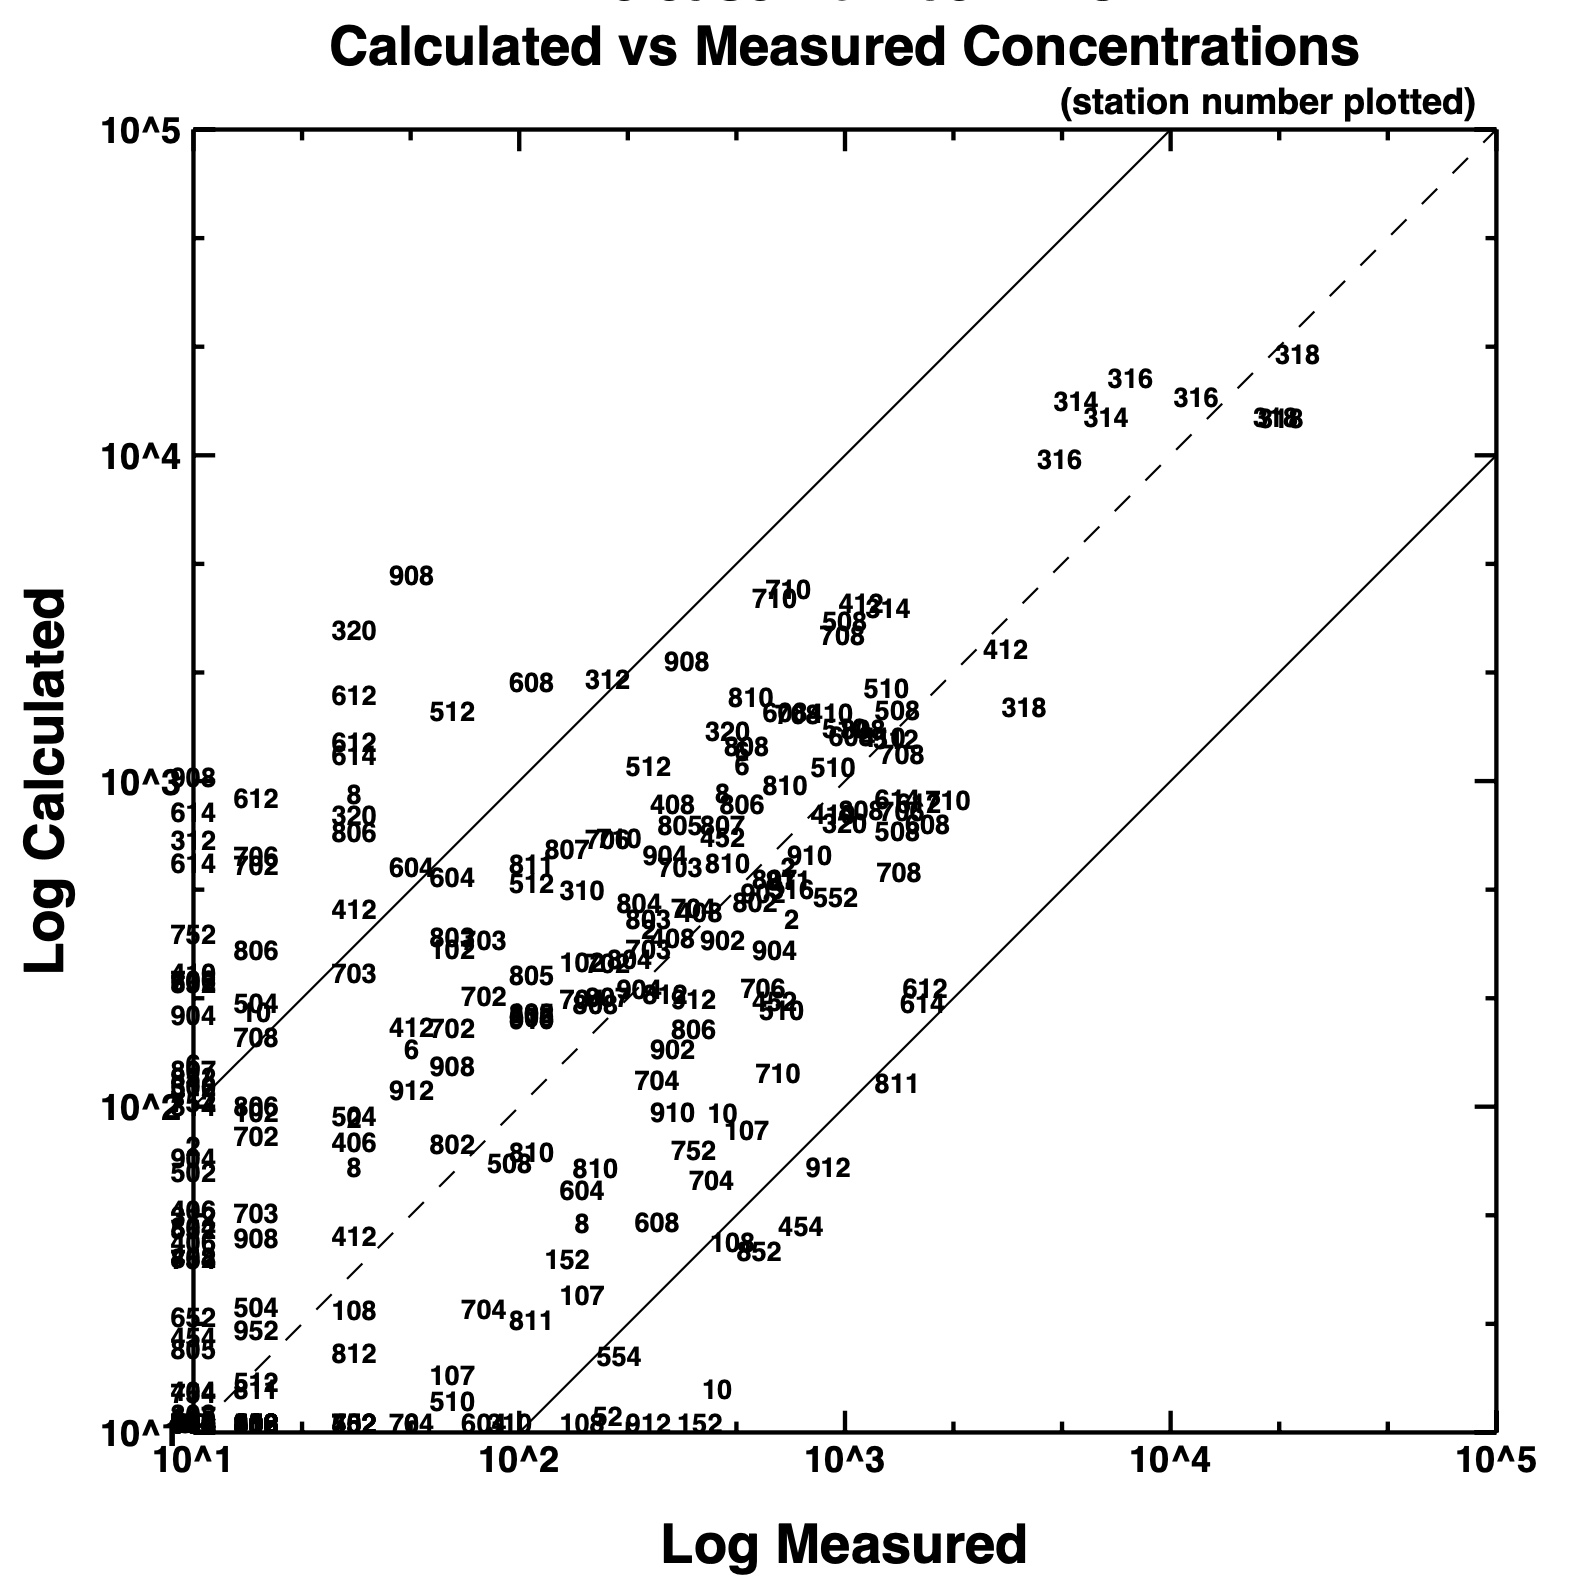
Compute Scatter Diagram of Ensemble Mean
Too broad a conclusion should not be inferred because the physics ensemble calculations were only a subset (26th 06Z to 28th 15Z) of the entire experimental period and too few particles were released in this example.
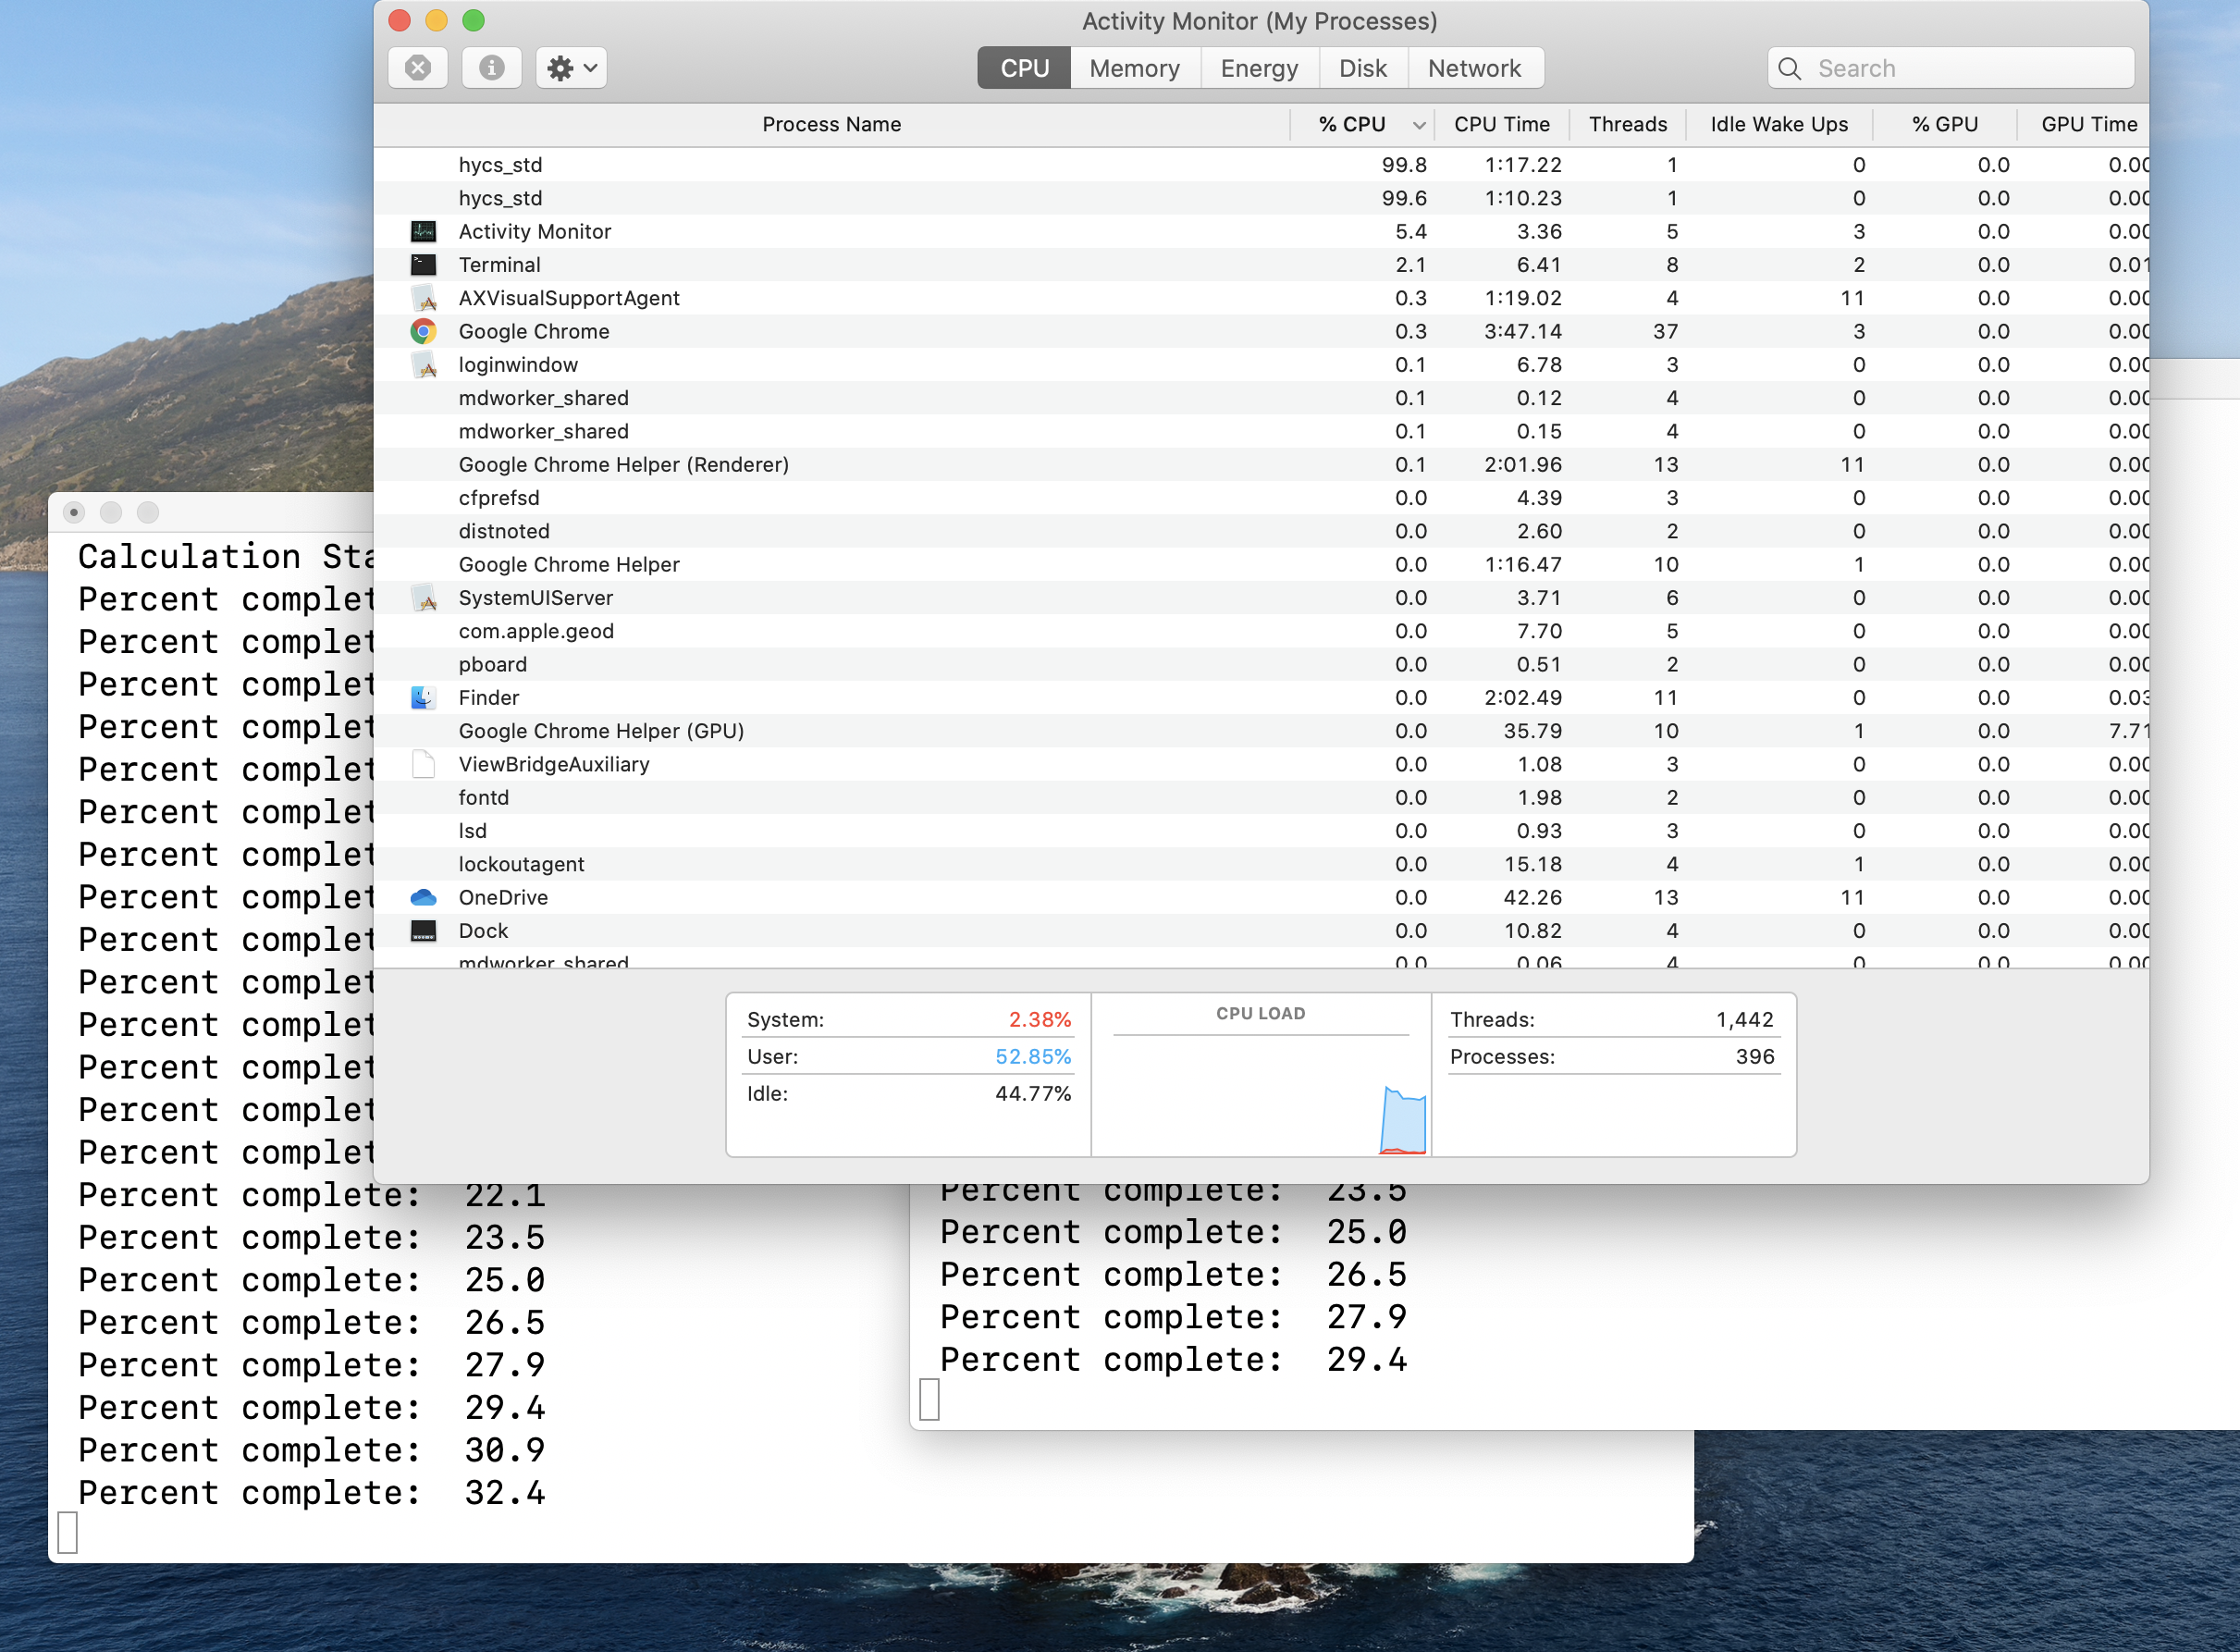
Utilization of More Than One Processor
Serial approach all systems
- Start by creating two new working directories parallel to the existing one
- Perhaps naming them work1 and work2
- Copy the previously saved captex_control.txt and captex_setup.txt into one of those directories
- Renaming the files CONTROL and SETUP.CFG
- Then edit the SETUP.CFG file reducing NUMPAR to 25,000
- Add a line for KRAND=4
- Copy both CONTROL and SETUP.CFG to the other work directory
- Edit each CONTROL file to give the concentration output file a unique name
- Open the command line or terminal, one for each work directory
- Start the HYSPLIT simulation in each by entering ../exec/hycs_std
- When complete, either through the GUI (Utilities / Binary File / Merge) or command line (program = concadd), to combine the two output files
Utilization of More Than One Processor
MPI special LINUX compilation
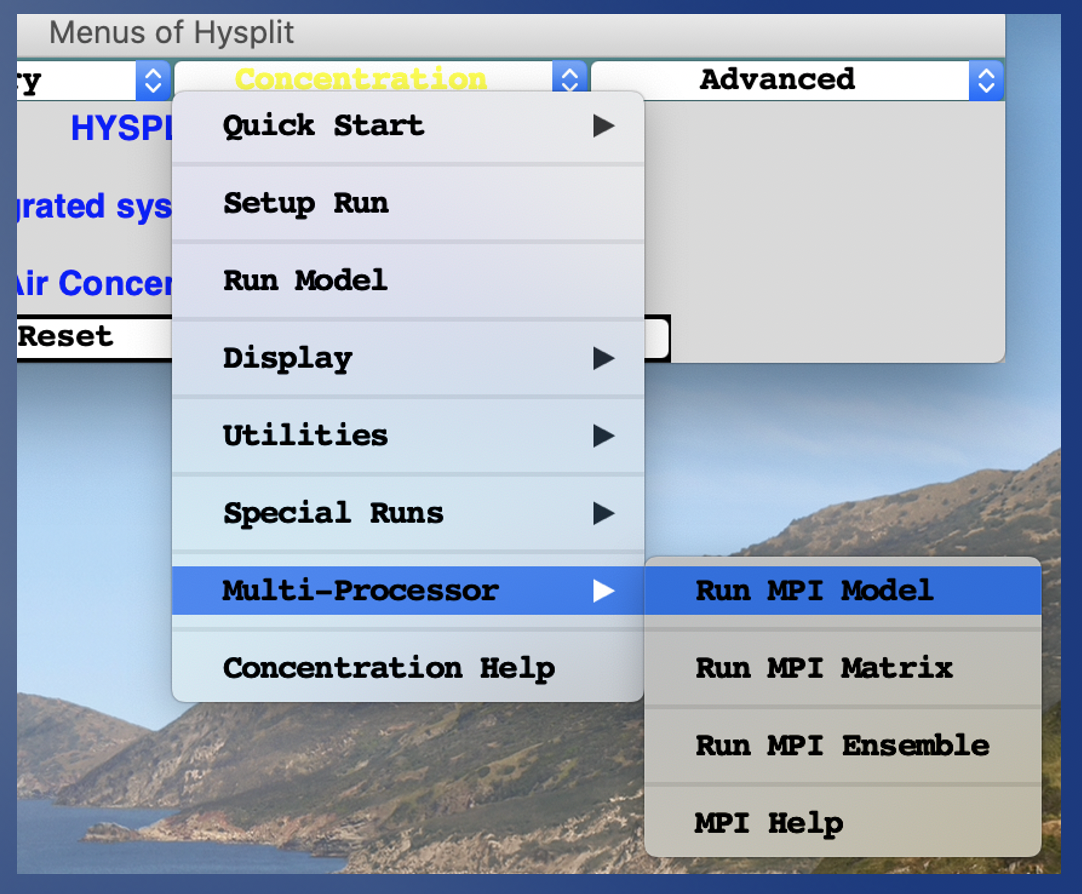
- Distributes particles among processors
- Requires download from mpich.org
- Edit: exec/run_mpi.sh for PATH & MPIPATH
- Edit: conc_mpi.tcl for arglist
- Runs hycm_std, _ens, and matrix