Exercise #8 |
Importing the ASCII Concentration Output File
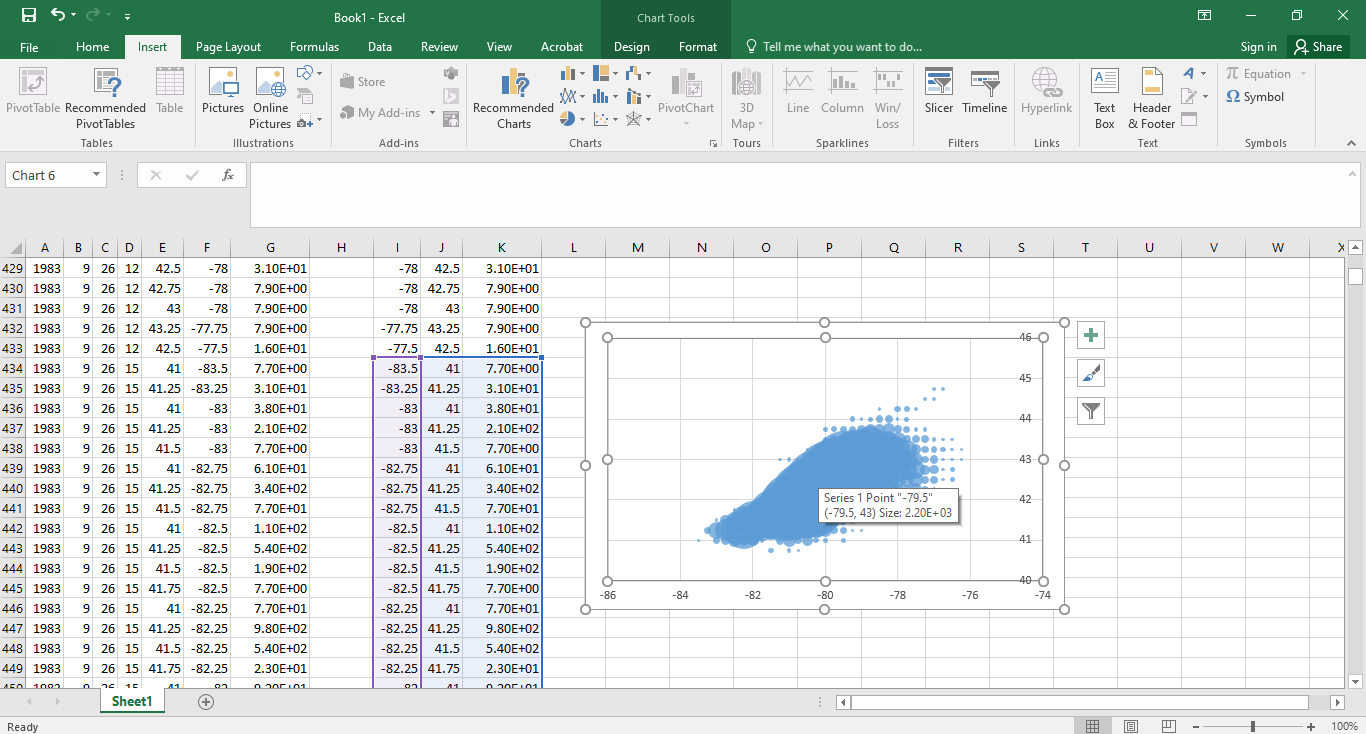
- Load hysplit2.bin.txt
- Reverse the latitude and longitude columns
- Select all the rows for the the 26th 1500UTC
- Create 2D bubble plot
Concentration Grid Size Sensitivity
- Load captex_control.txt and captex_setup.txt
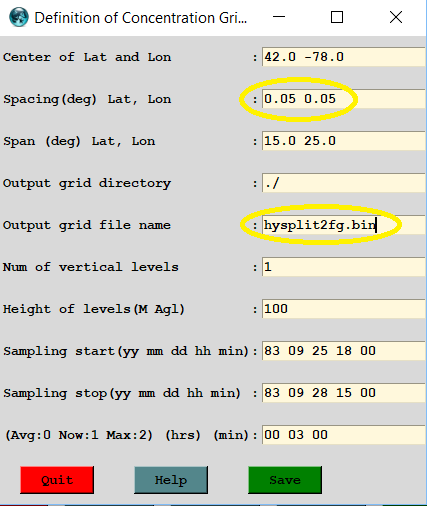
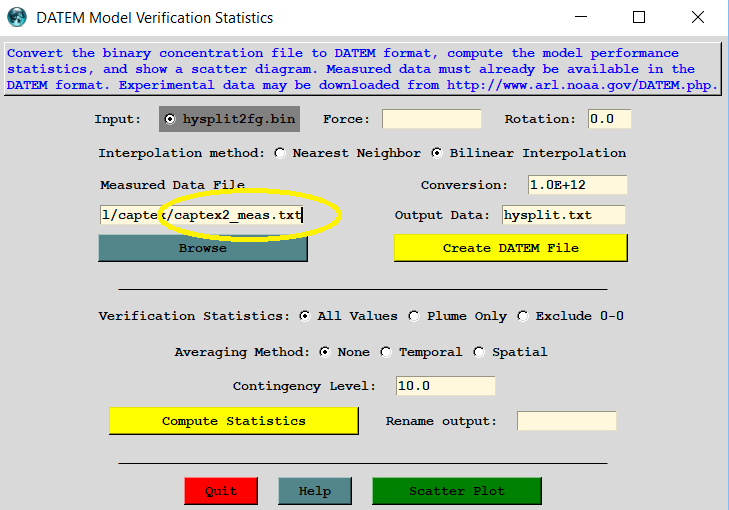
- Change the grid size to 0.05 and name output file captex2fg.bin
- and then run the simulation
Extract the time series at Little Valley, NY
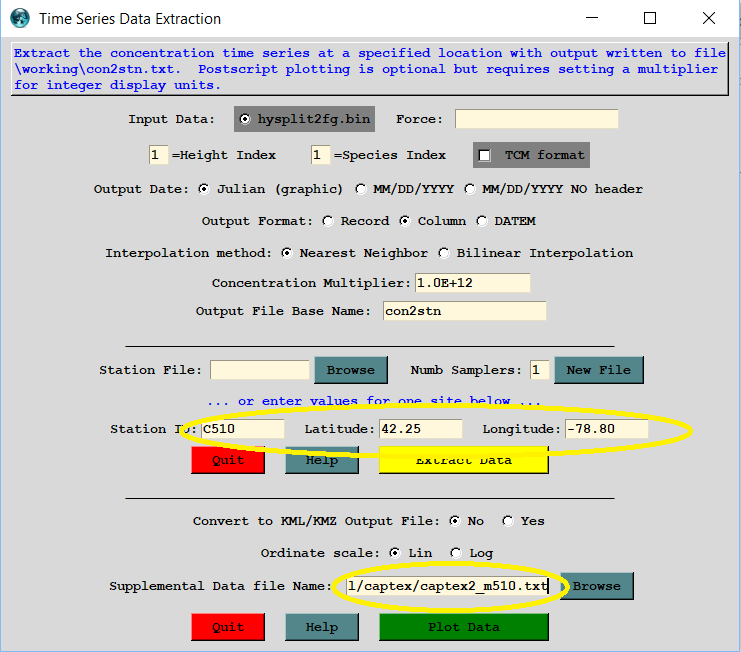
Create the statistical output
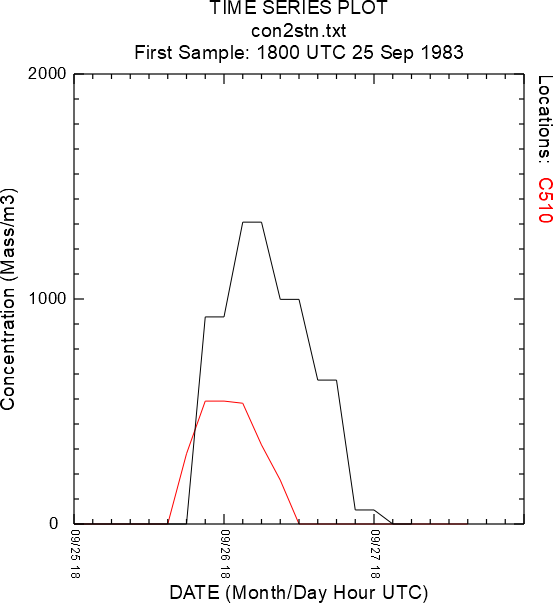
Although the statistical metrics showed that the fine grid simulation was similar to the coarse grid simulation, the time series at Little Valley showed much lower concentrations than were measured.
Meteorological Grid Size Sensitivity
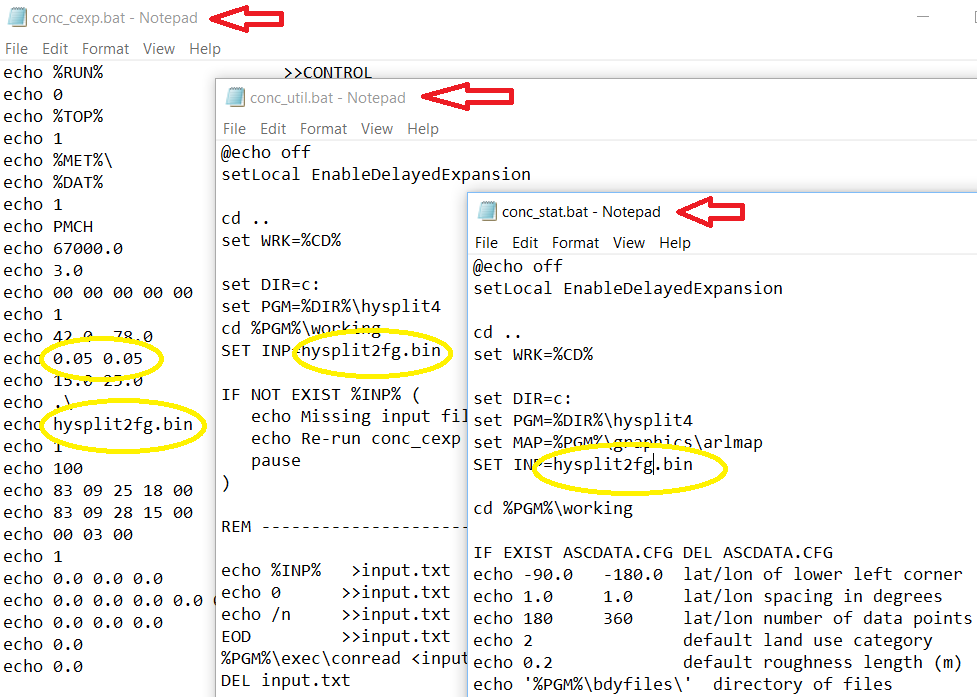
Alternate approach edit and run the batch files:
conc_cexp.bat, conc_util.bat, and conc_stat.bat
Extract the time series at Little Valley, NY
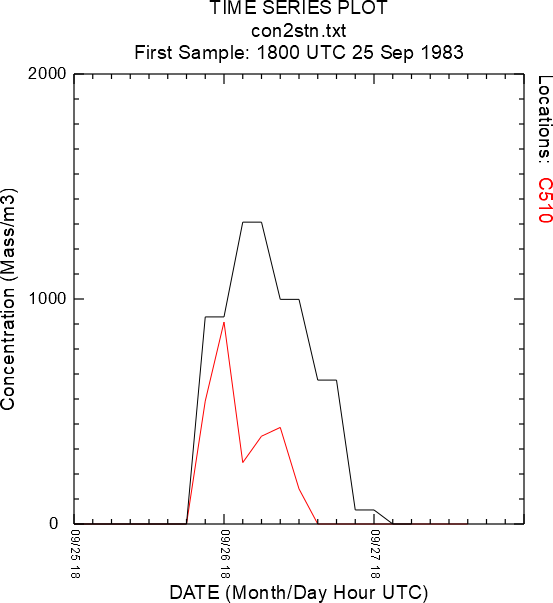
At this location, using the 9 km meteorology showed a slightly better fit with the measured time series as well as a slight improvement in the overall statistical results.