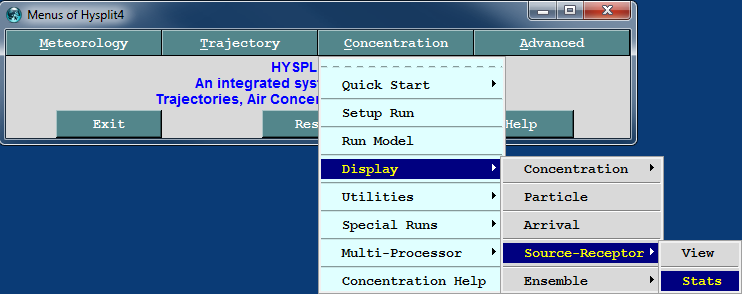
- This application uses the matrix source results to find which location
gives the best fit with the measured data
- Any one of 6 statistical metrics can be chosen to determine the best fit
matrix_control.txt | load control file |
matrix_setup.txt | load setup file |
srm.bin | available and set in GUI |
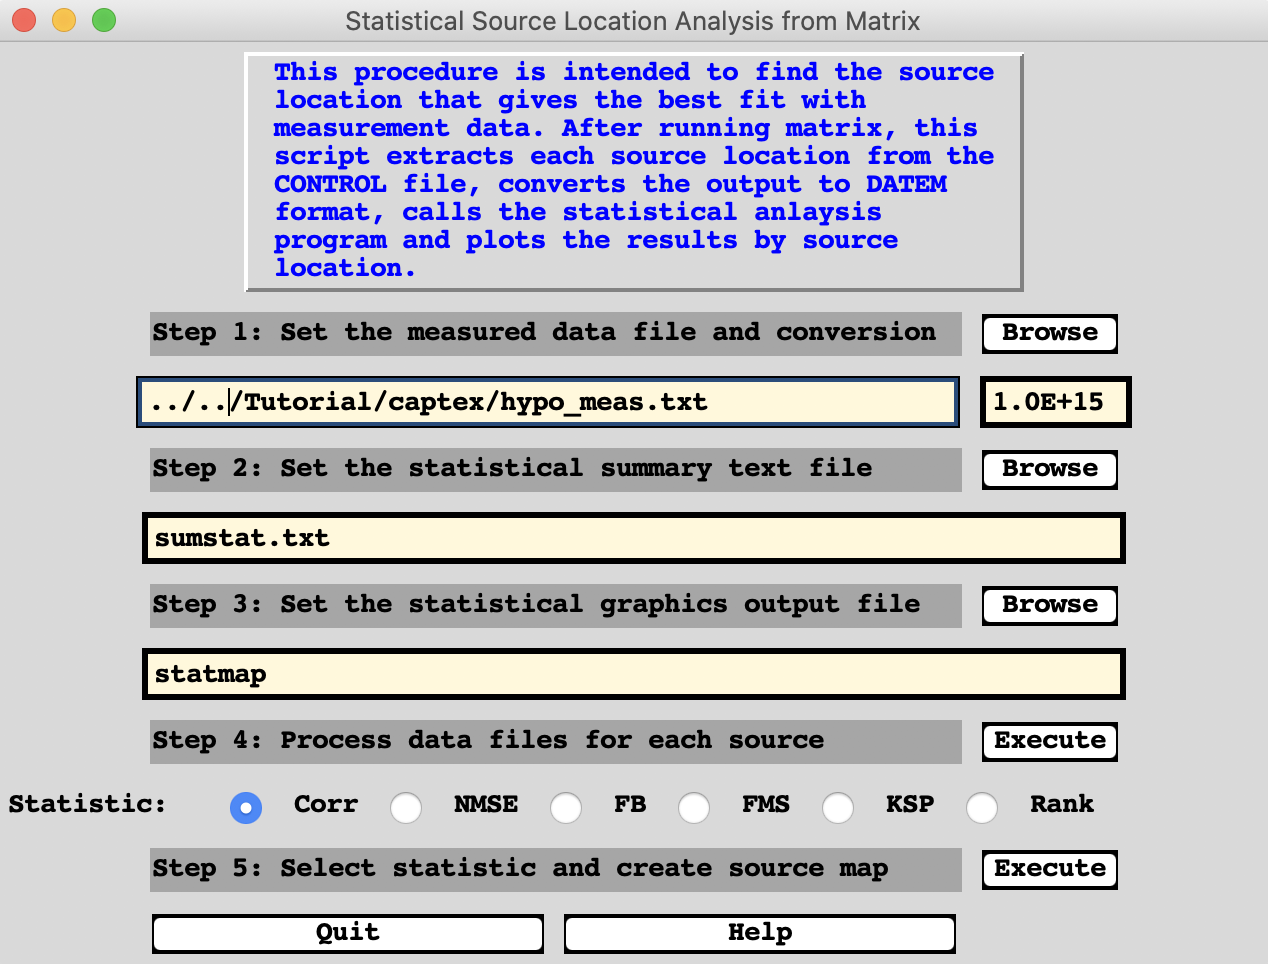
1.0E+15 | units conversion factor |
hypo_meas.txt | 3-hour measurements |
Step 4 - Execute | generate statistics |
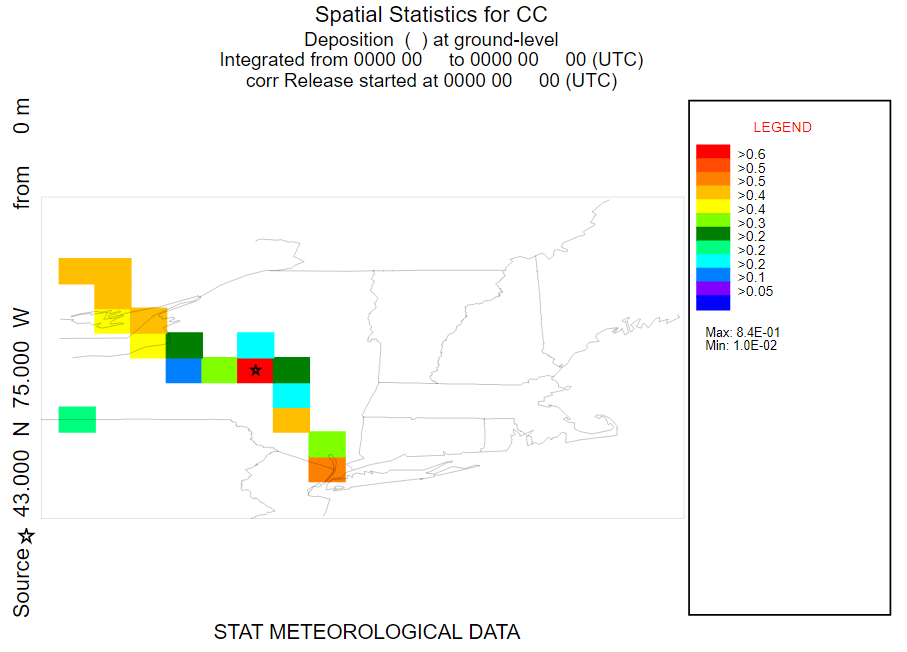
Corr radiobutton | Select Correlation |
Step 5 - Execute | show correlation map |
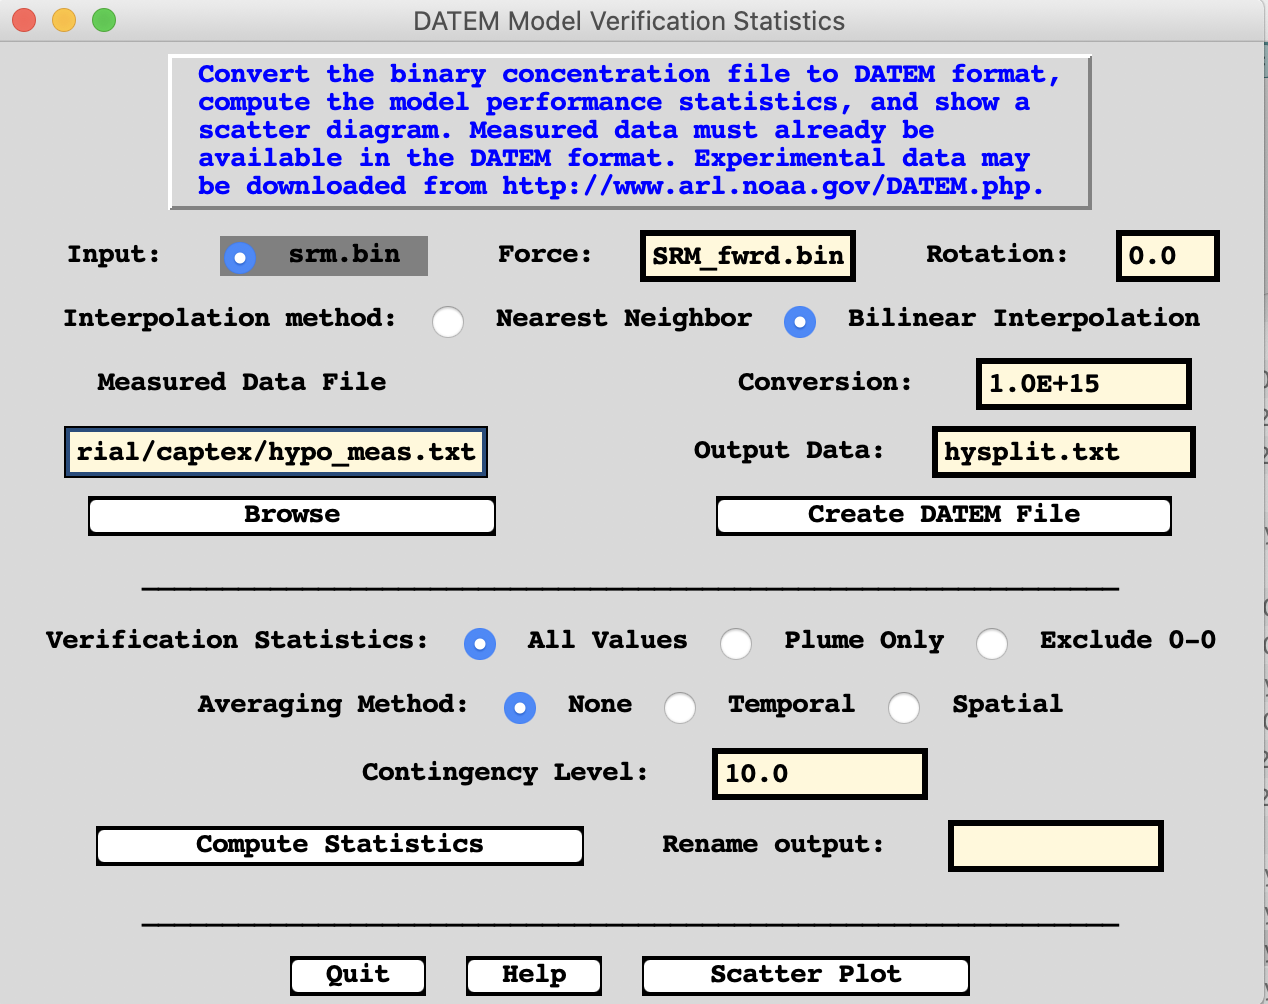
SRM_fwrd.bin | Concentrations from 43N 75W |
| created in the previous section |
1.0E+15 | Emission rate in pg |
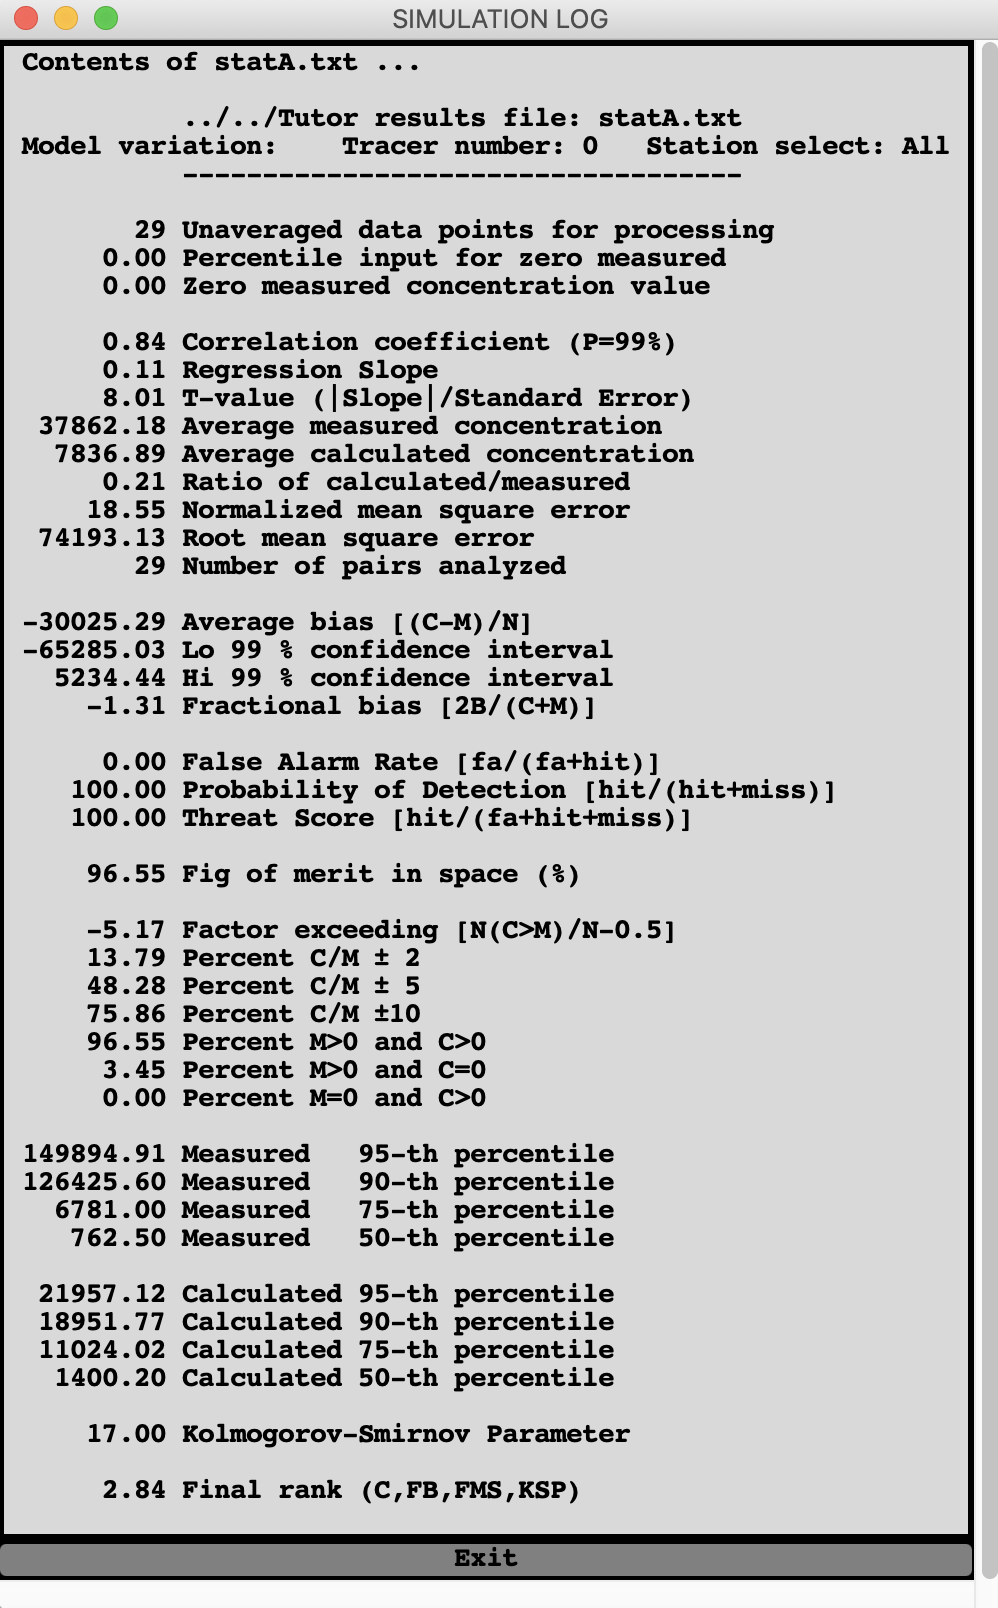
C/M=0.21 | Emissions rate needs to be 5000 g/h |
|