Source-Receptor Matrix |
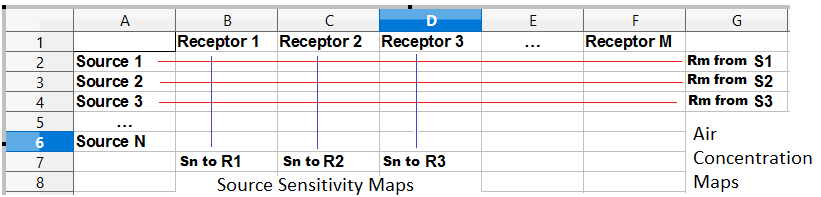
- Set ichem=1 so that each source location has its own concentration grid
- Multiple sources run simultaneously
- Model output results are treated as a matrix
- Each row represents a source, a concentration grid cell per column
- Each column receptor, the rows represent the contribution from each source
Reset Button | clear GUI |
geol_control.txt | load control file |
geol_setup.txt | . load setup file |
60 | Run duration |
RP198309.gbl | Meteorology |
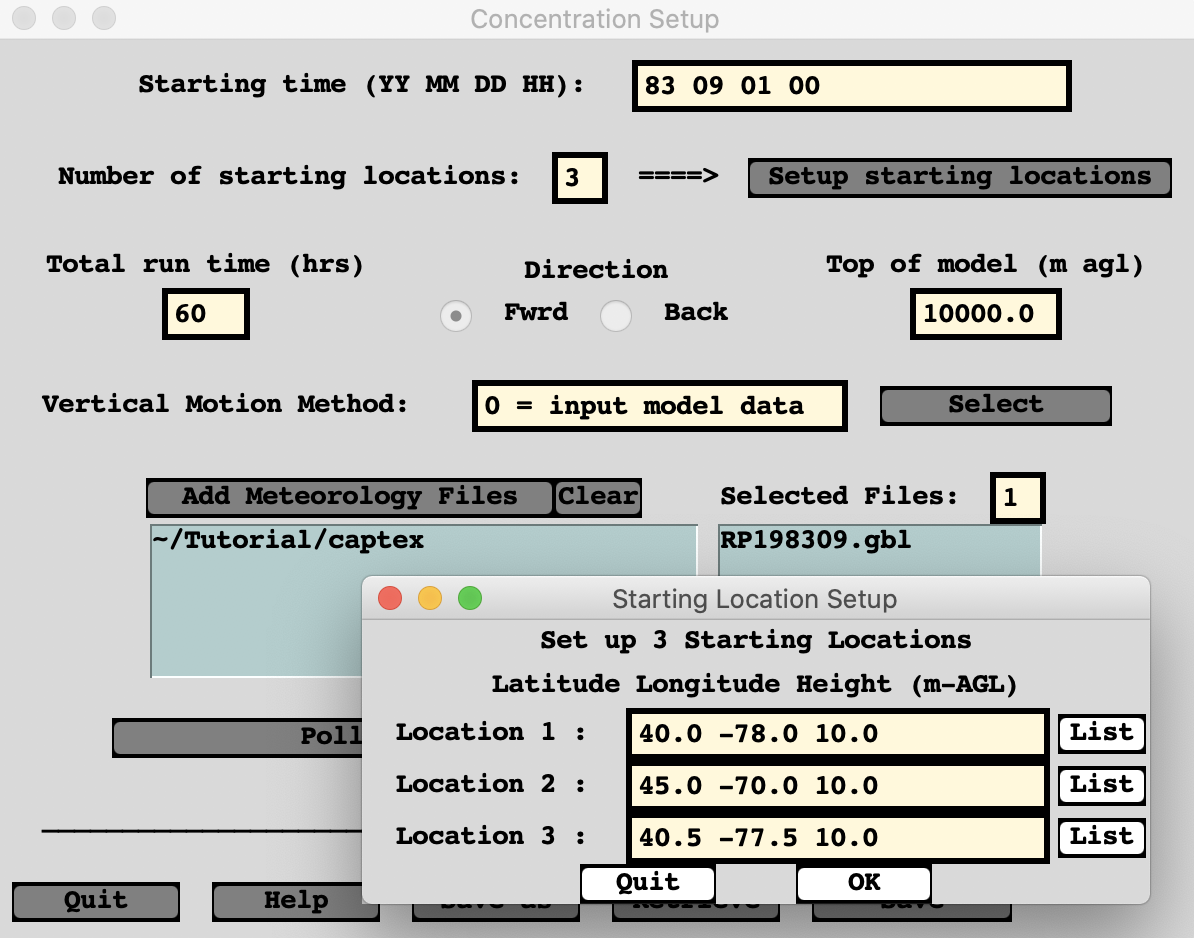
40.0 -78.0 | Lower left |
45.0 -70.0 | Upper right |
40.5 -77.5 | 1st grid point |
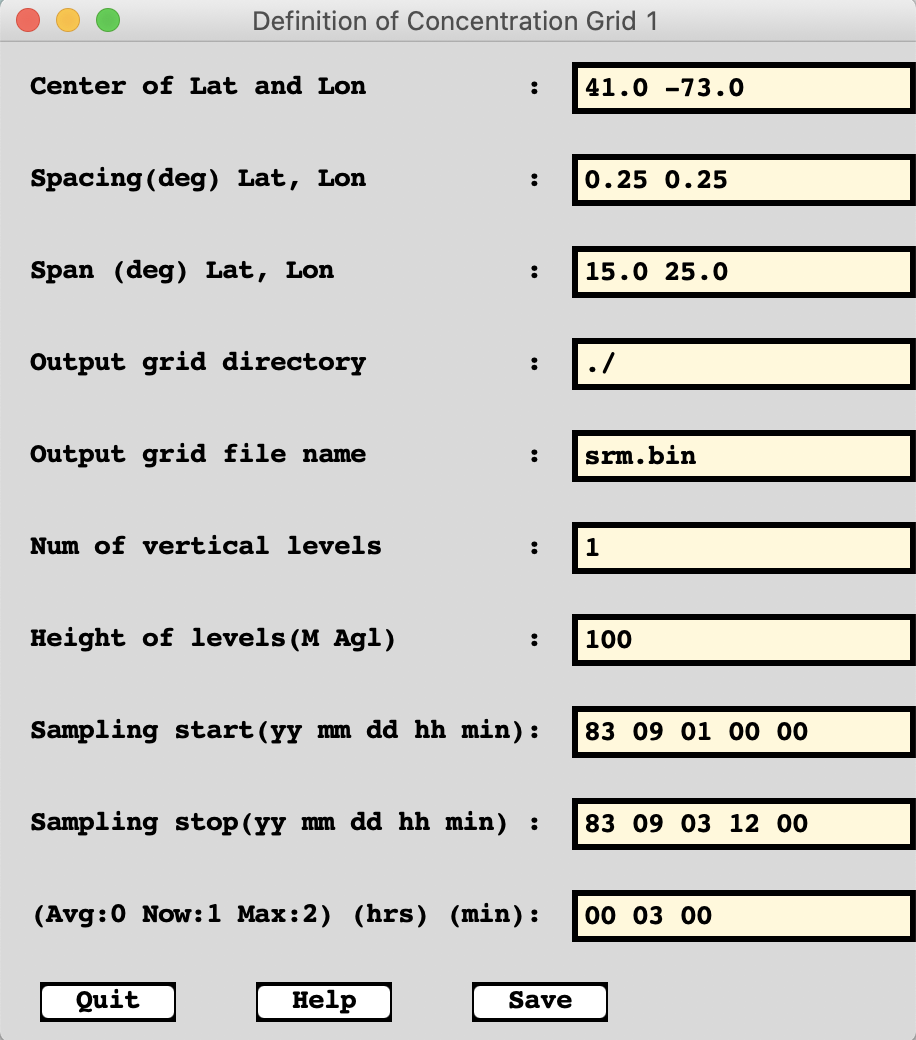
41.0 -73.0 | Grid center location |
srm.bin | Output file name |
83 09 01 00 00 | Sample start time |
83 09 03 12 00 | Sample stop time |
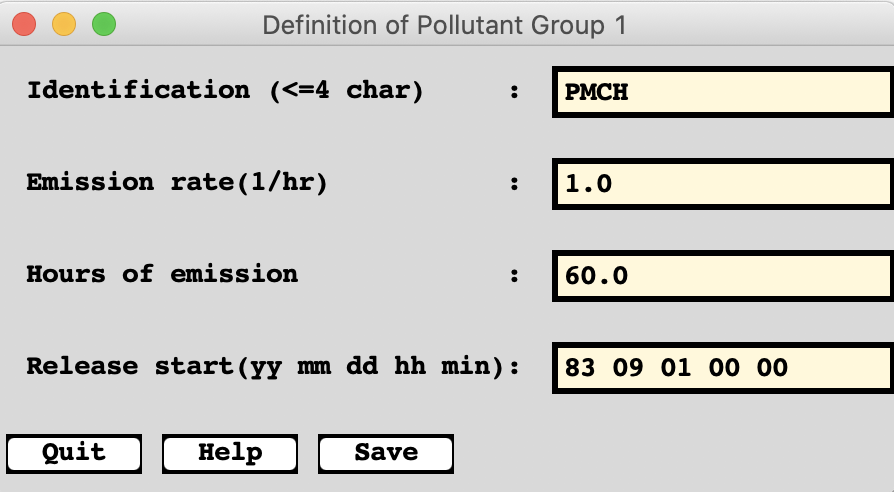
1.0 | Emission rate |
60.0 | Emission duration |
83 09 01 00 00 | Emission start time |
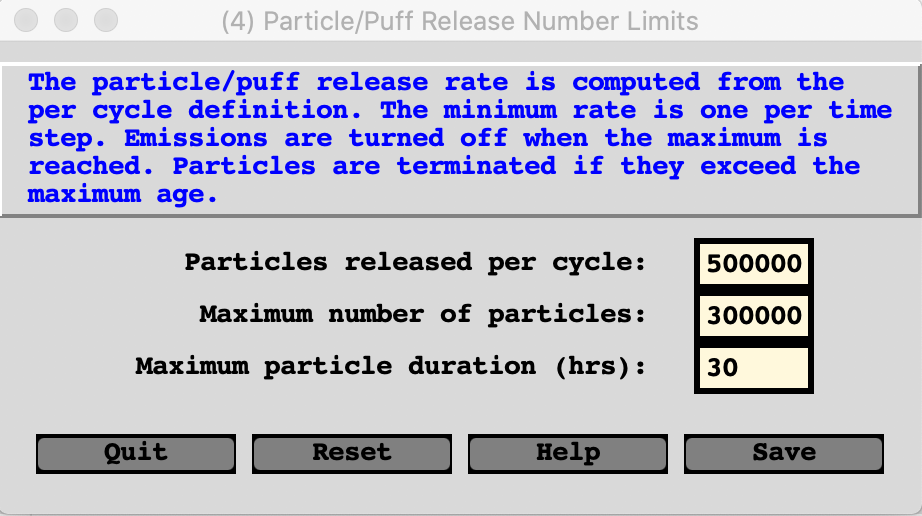
500000 | namelist number of particles |
300000 | namelist maximum number |
30 | namelist maximum duration |
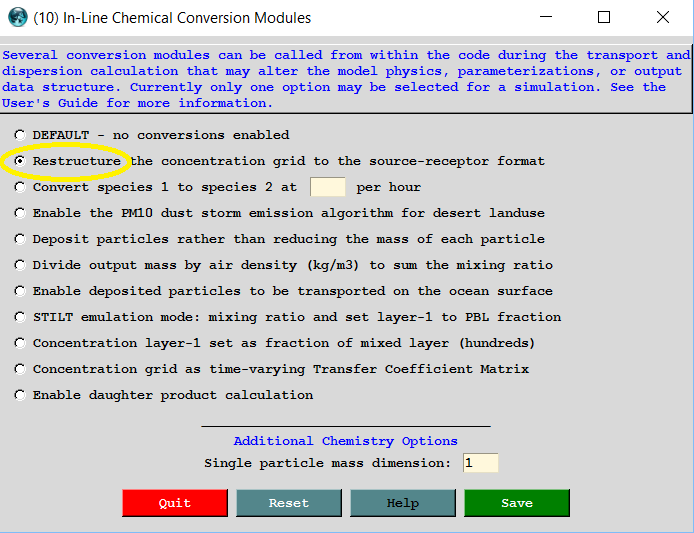
ichem=1 | namelist source-receptor grid |
Start model from the "Special Runs / Matrix" tab
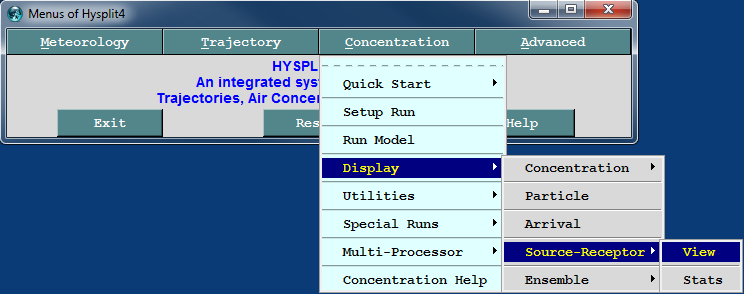
Extracting Information from the Matrix
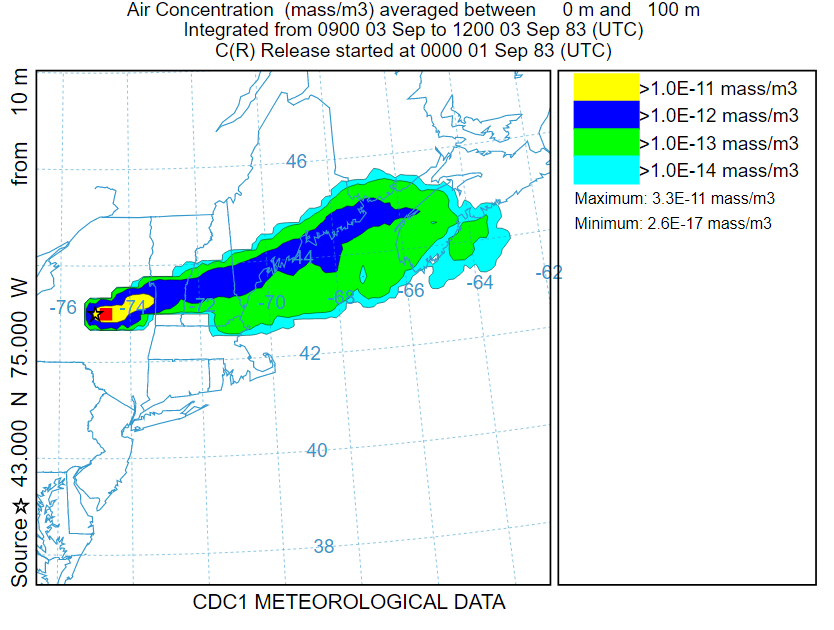
Post-processing output options are standard concentration maps for a source or source-location maps for each receptor
Source location calculation
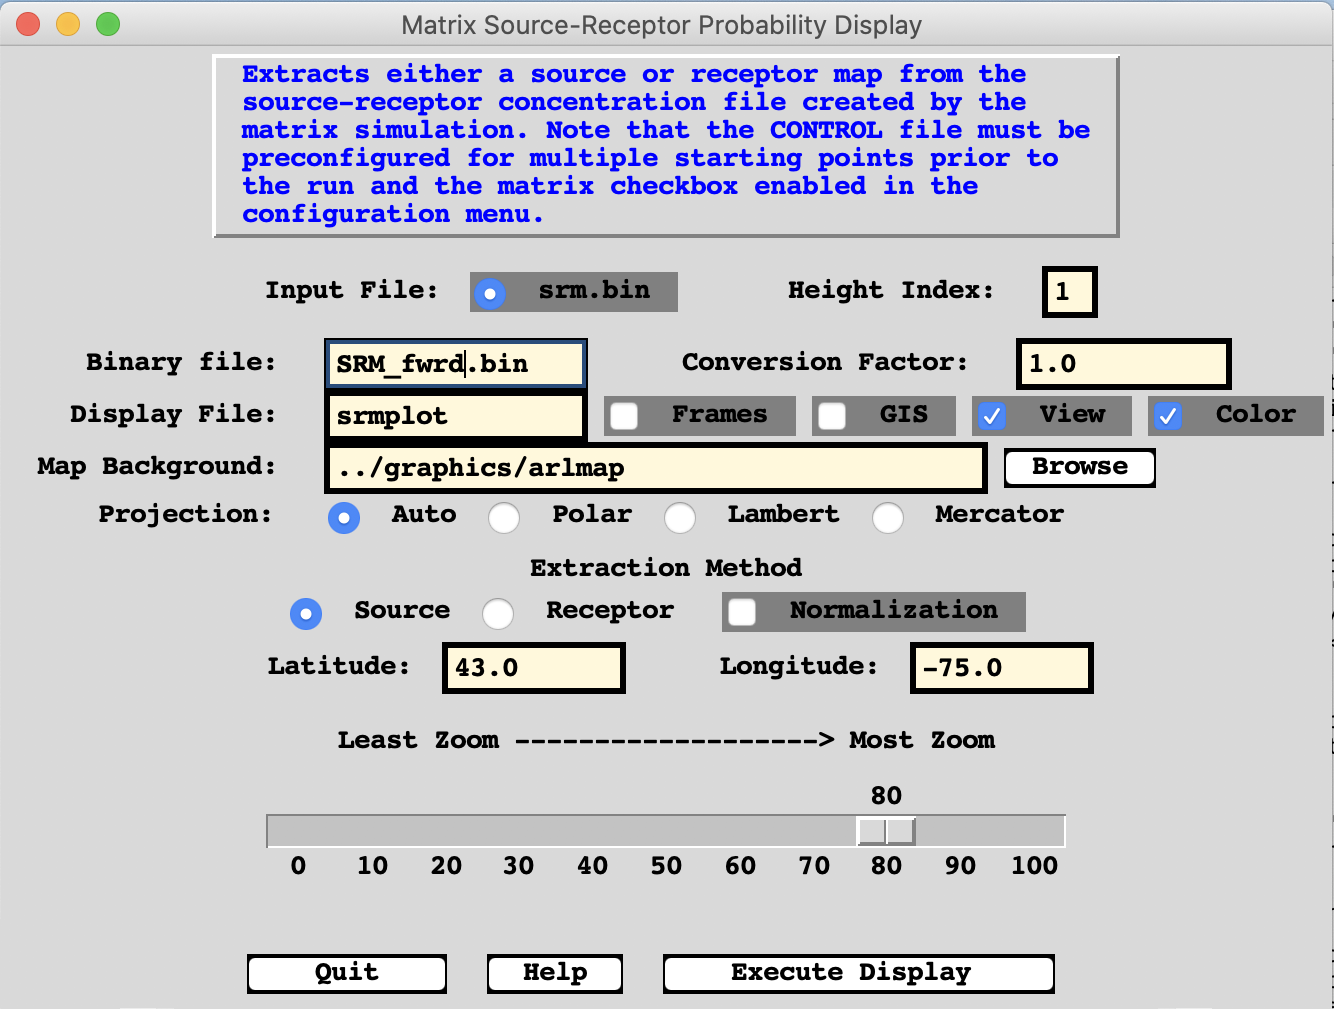
SRM_fwrd.bin | Binary output file |
43.0 -75.0 | Source location |
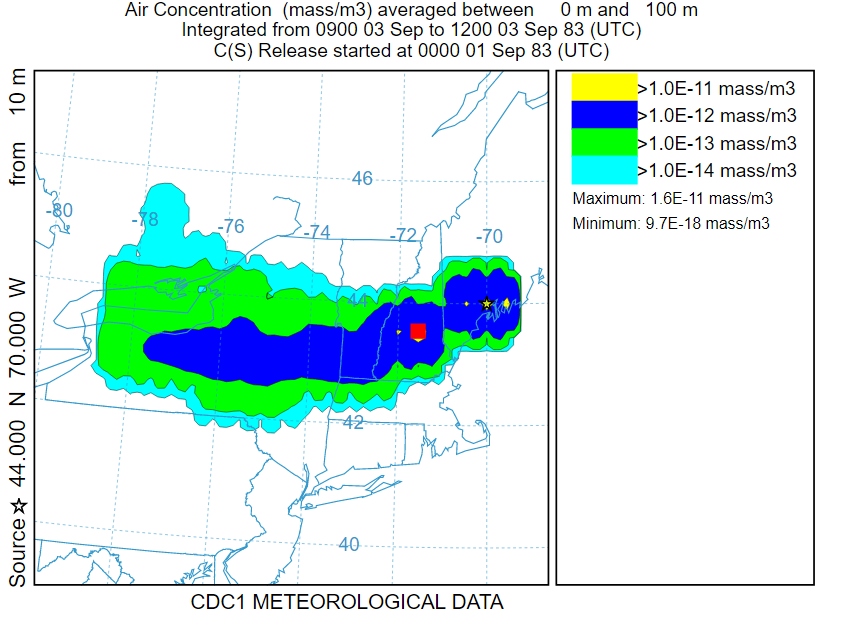
Receptor location calculation
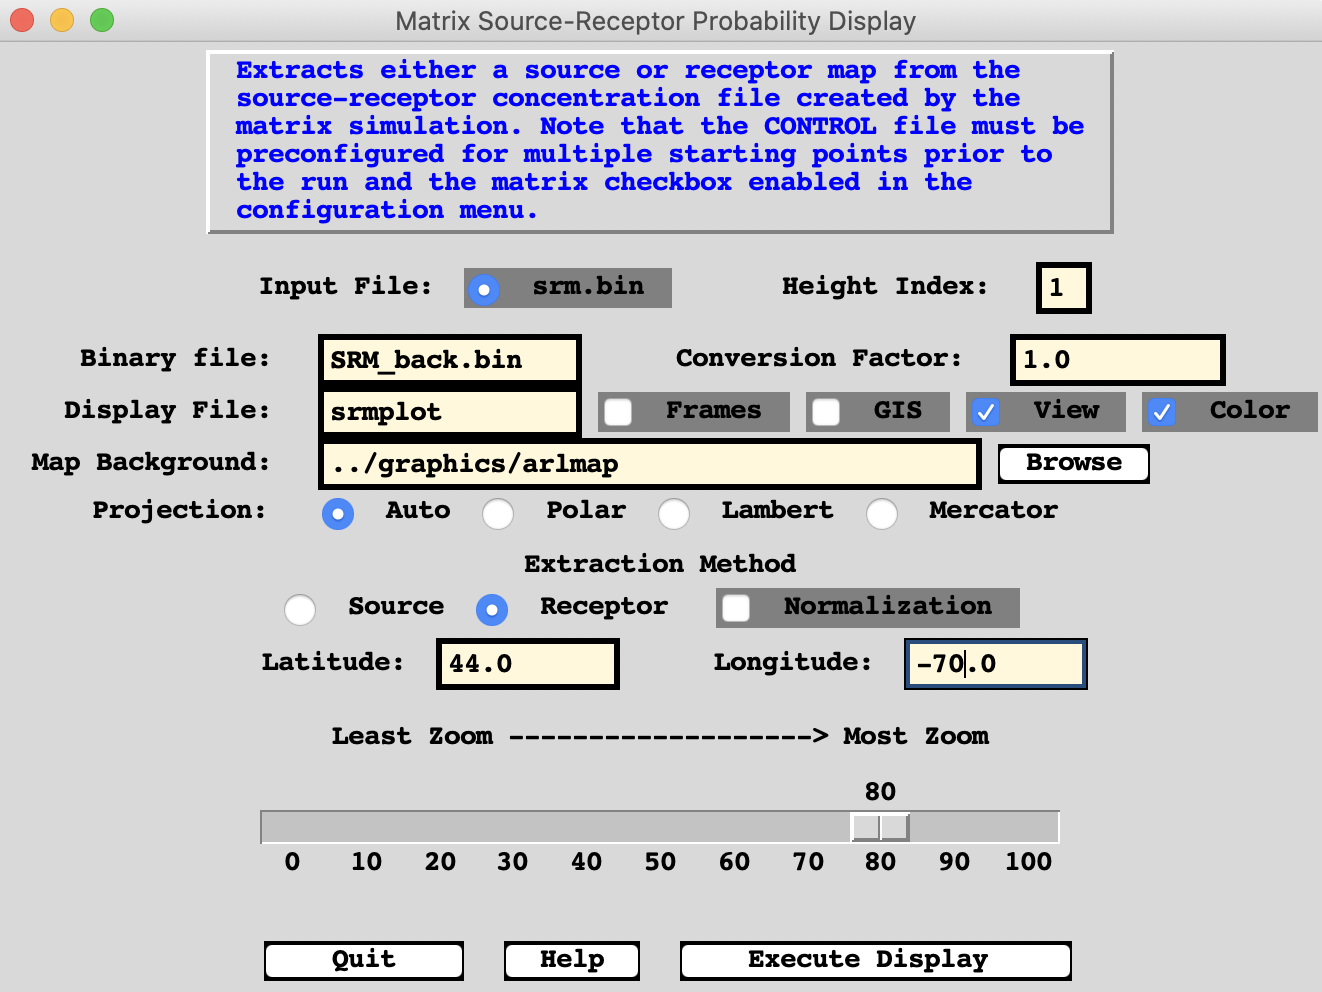
SRM_back.bin | Binary output file |
44.0 -70.0 | Sampler location |
matrix_control.txt | save control file |
matrix_setup.txt | save setup file |