Emissions from an Unknown Source |
- Backward calculations are automatically configured in a pre-processor step
from a sampling data file in DATEM format - A hypotethical example is used here because the CAPTEX case is not ideal
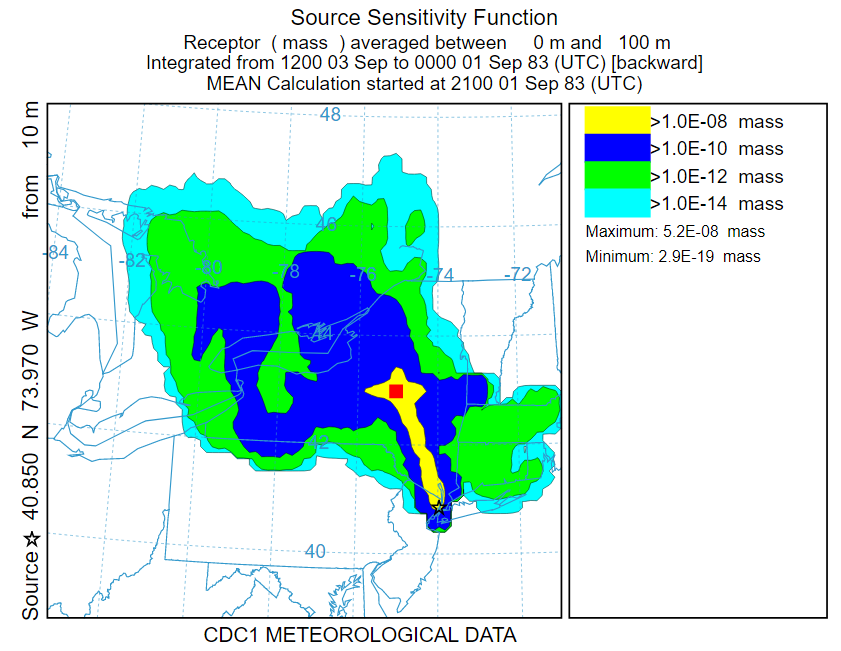
due to the near constant wind direction - In the first example, the "numerator" case, the backward calculation
emission rate is equal to the measured value giving more weight to the source
regions contributing to the highest measurements
Reset Button | clear GUI |
Source location weighted by measurement
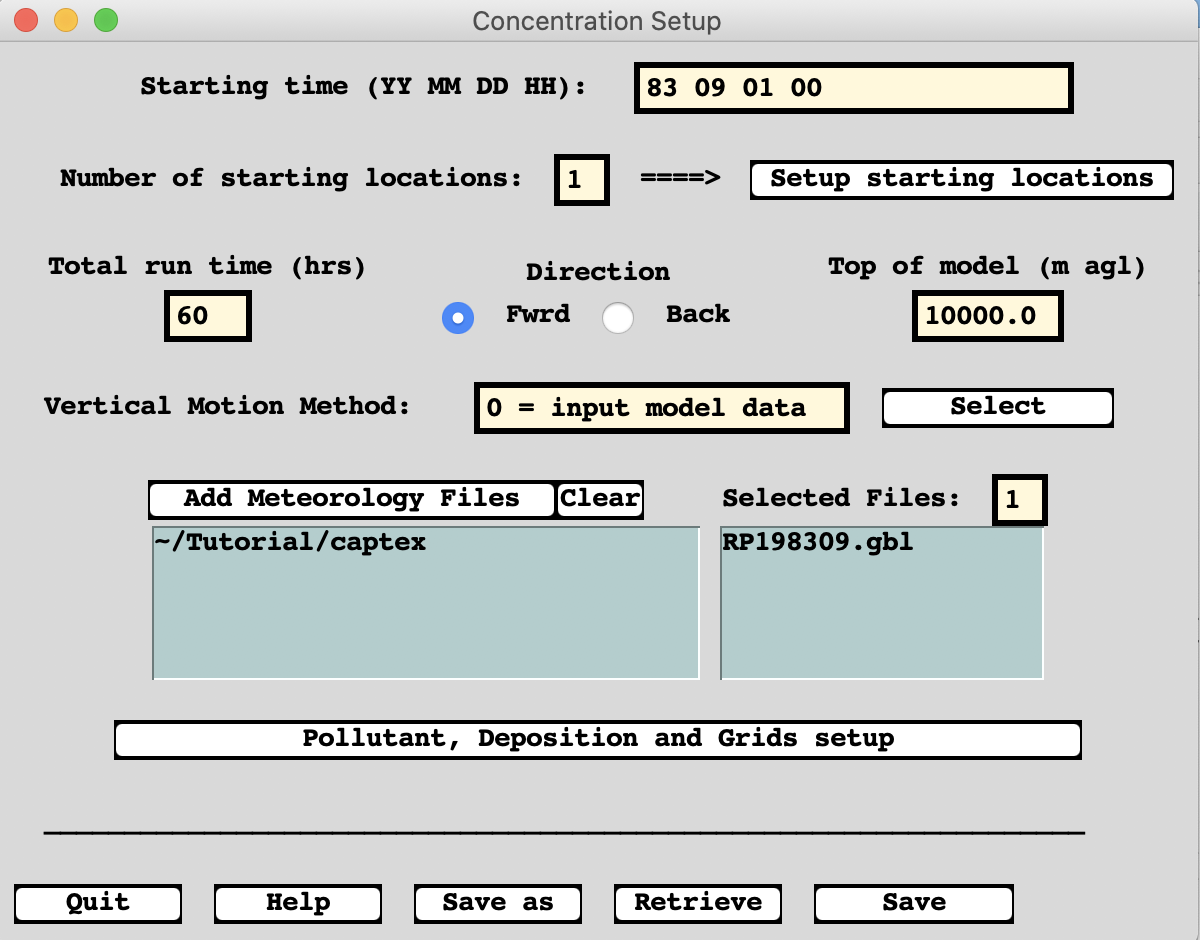
83 09 01 00 | Run start time |
60 | Run duration |
RP198309.gbl | Meteorology |
Starting location | Doesn't matter |
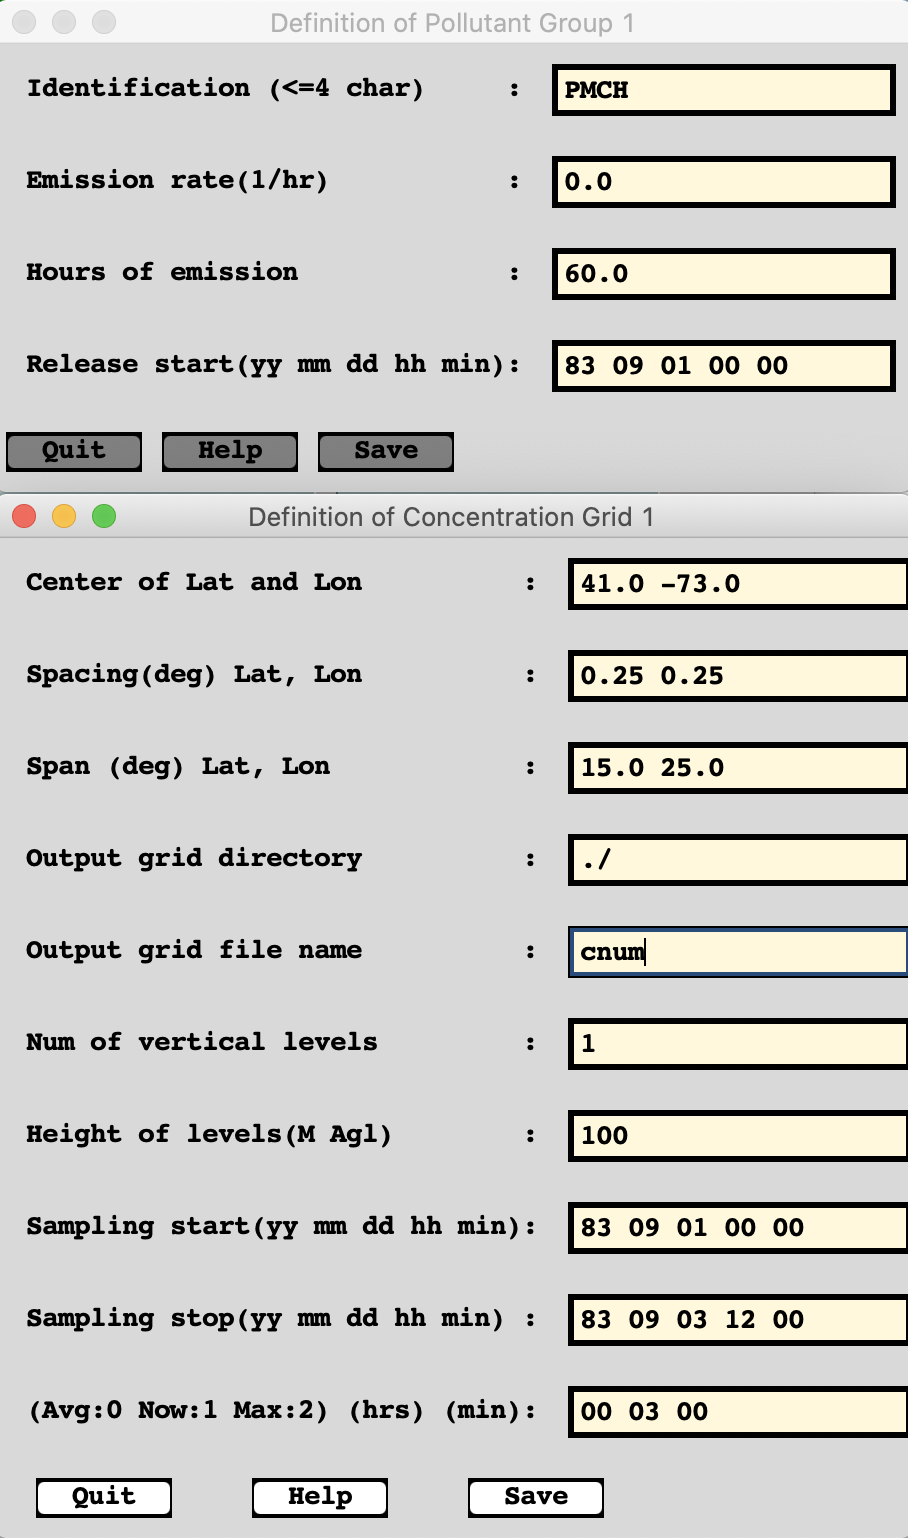
0.0 | Emission rate |
60.0 | Emission duration |
83 09 01 00 00 | Emission start |
41.0 -73.0 | Concentration grid center |
0.25 0.25 | Grid resolution |
cnum | Output file (for numerator) |
83 09 01 00 00 | Grid start |
83 09 03 12 00 | Grid stop |
00 03 00 | Averaging period |
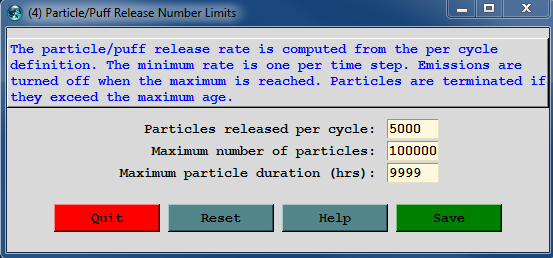
5000 | namelist particle number |
Step 1 - define measured data
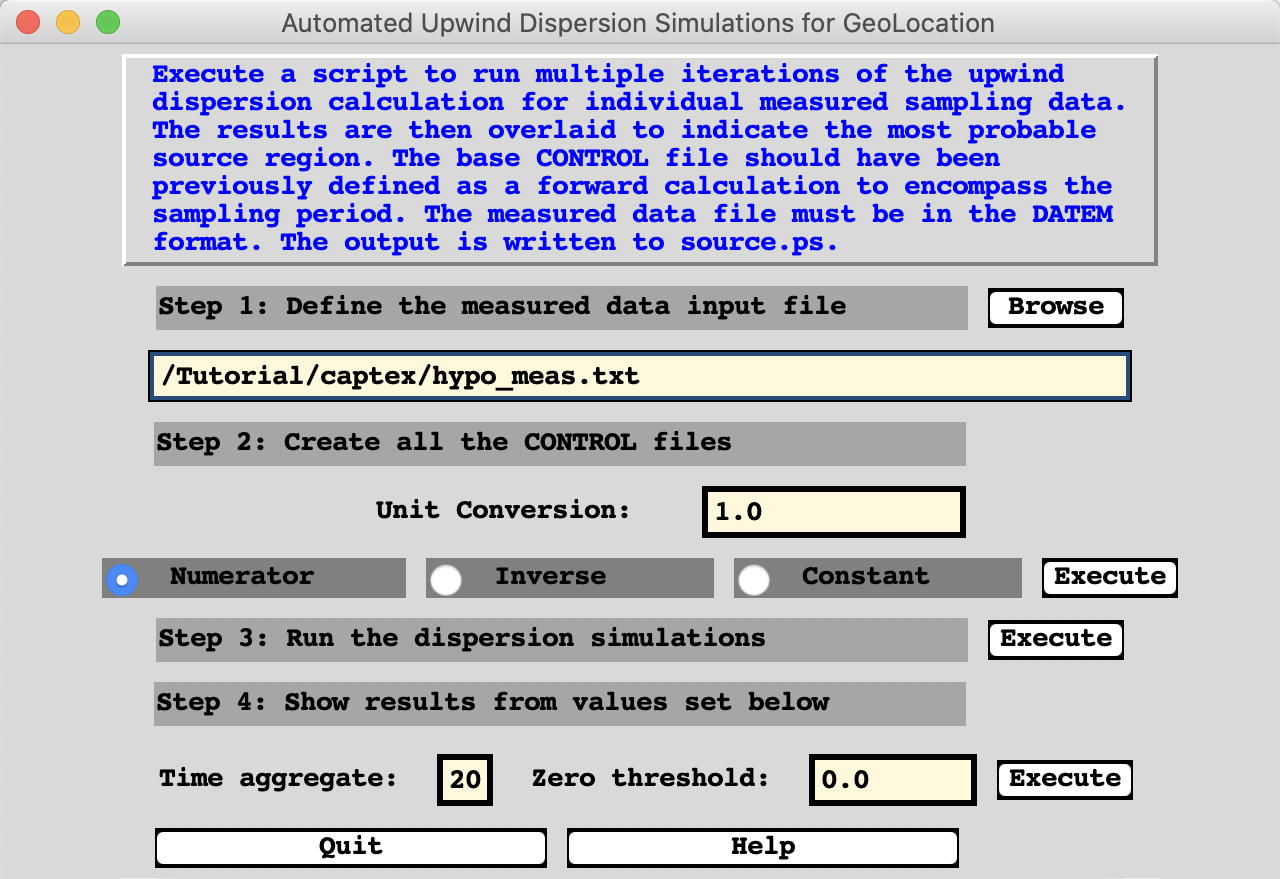
hypo_meas.txt | 3-hour duration samples |
numerator radiobutton | set calculation Q=M |
Step 2 - create backward CONTROL files
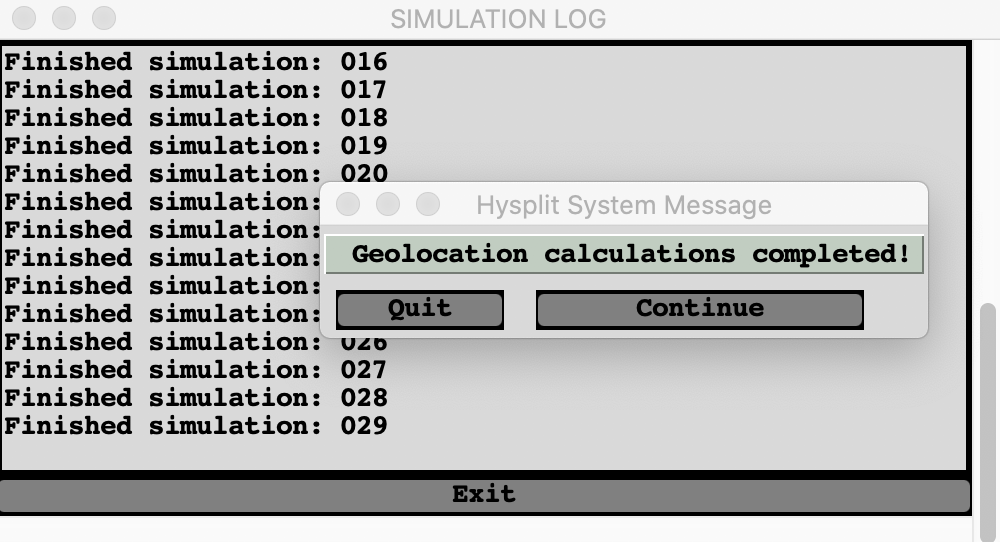
Step 3 - run dispersion simulations
Step 4 - display results
20 | set time aggregate to 20 (for 60 h) |
Emission estimate calculation:
weighted by inverse of measurement
- Emission rate is set to the inverse of the measurement (1/M)
- From before, M=DQ, the model computes C=DQ
- If Q is set to 1/M, the the model computes D/M
- Then the model output is the same as 1/Q
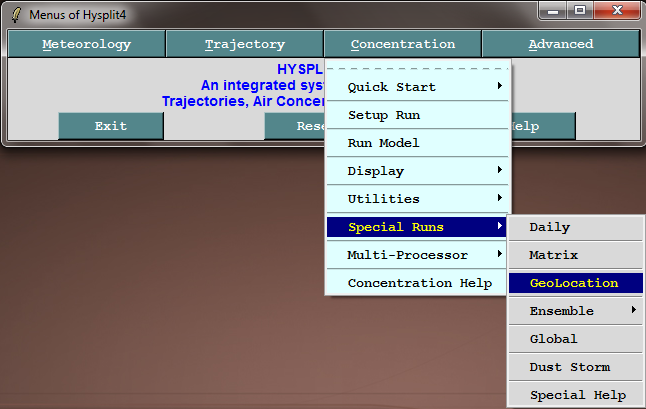
Step 0 - Special Runs / Ensemble / Cleanup
Step 1 - Set inverse radiobutton (Q=1/M)
Step 2 - create backward CONTROL files
Step 3 - run dispersion simulations
Step 4 - display emission: inverse at source location
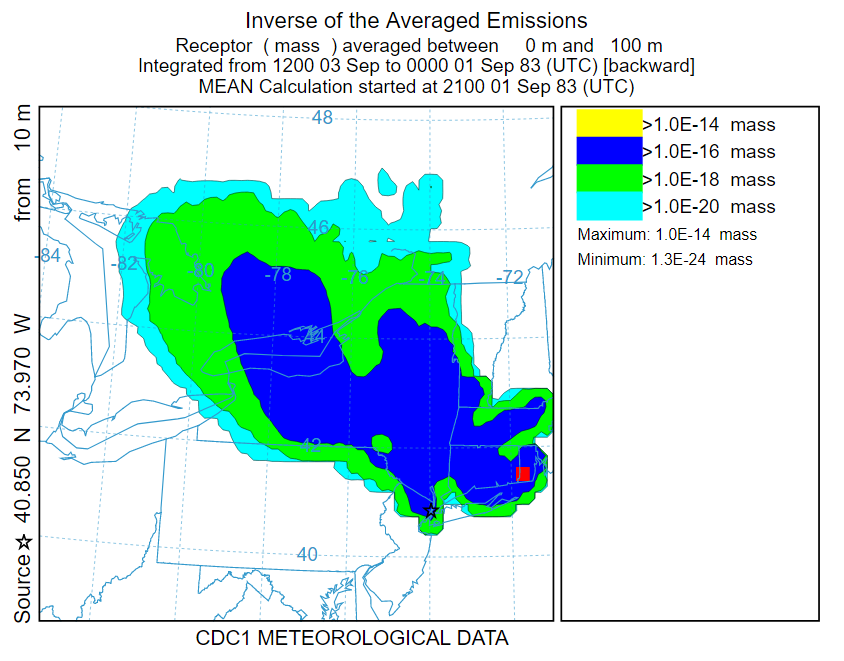
Step Y - Extract value at 43N 75W
Step Z - Inverse of 0.584x10⁻¹⁵ pg/h = 1700 g/h
As the dilution increases, the emission rate must increase to maintain the same measurement, hence other engineering information can be used to estimated the maximum emission rate possible and hence the contour the limits the emission regions.