Exercise #7 |
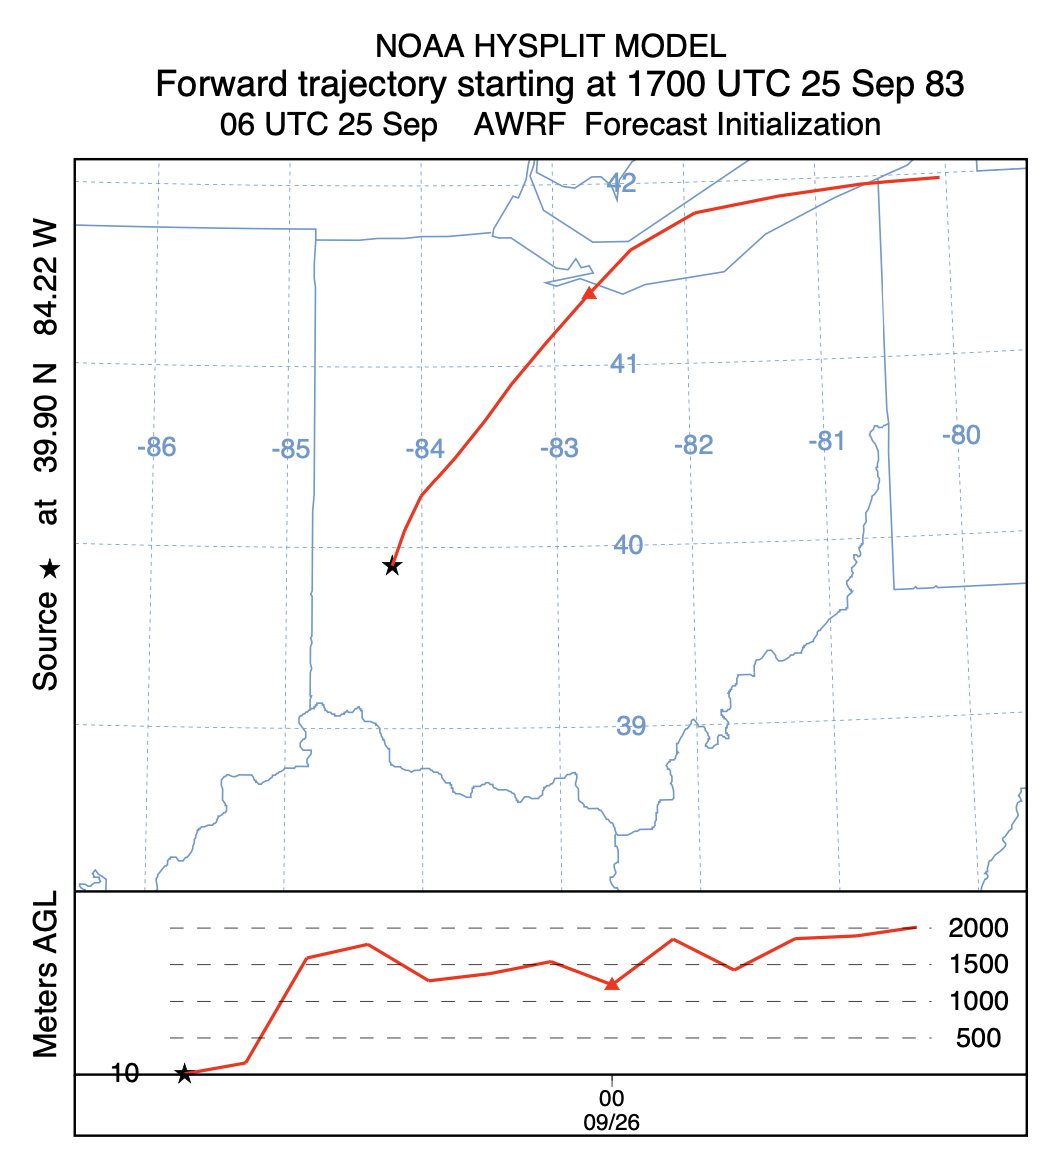
Hour‐to‐Hour Height Variation
Rerun the single particle concentration simulation
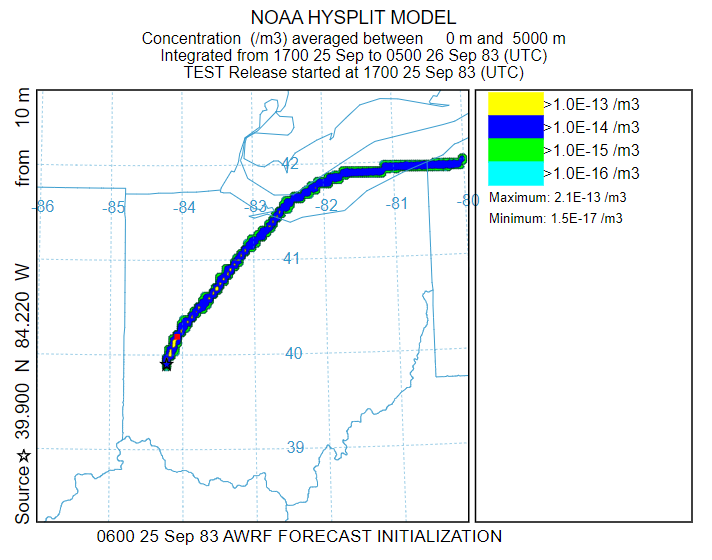
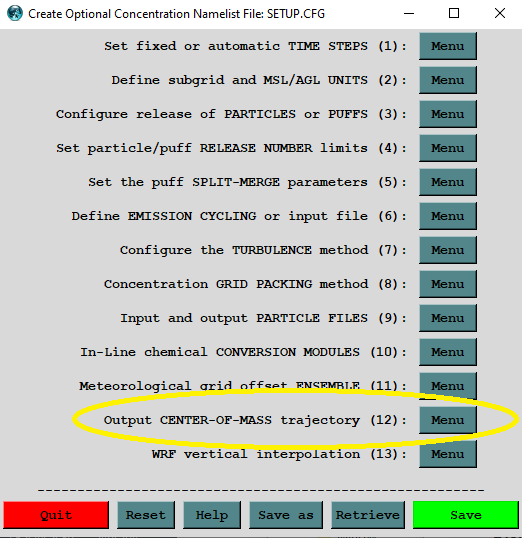
But turn on the center‐of‐Mass trajectory output
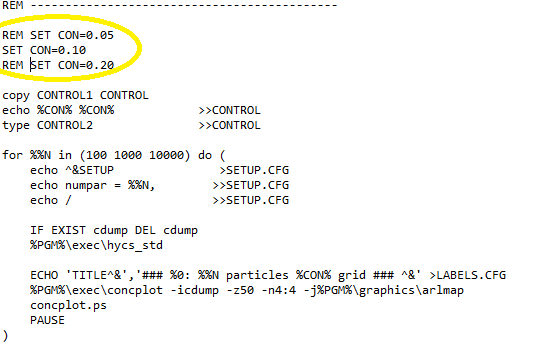
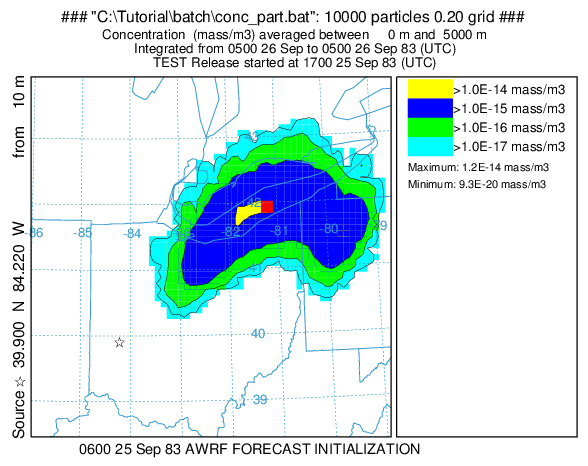
Sensitivity of Maximum Concentration to Grid Size
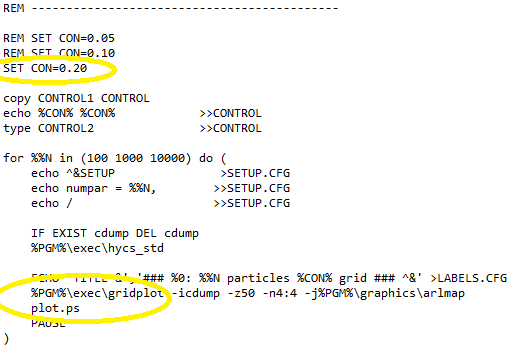
Edit conc_part.bat (or .sh)
with different concentration grid resolutions: 0.10, 0.20, ...
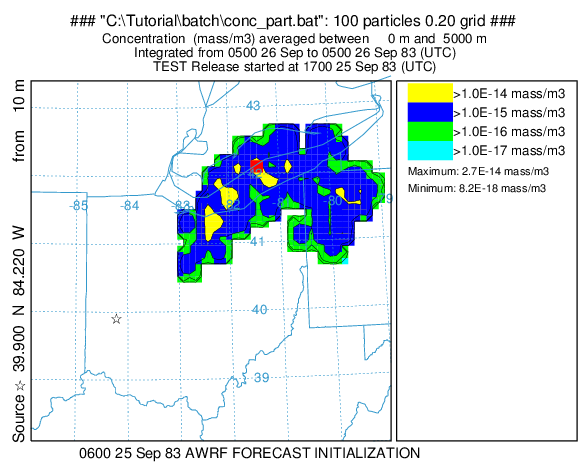
Simulation with 100 particles
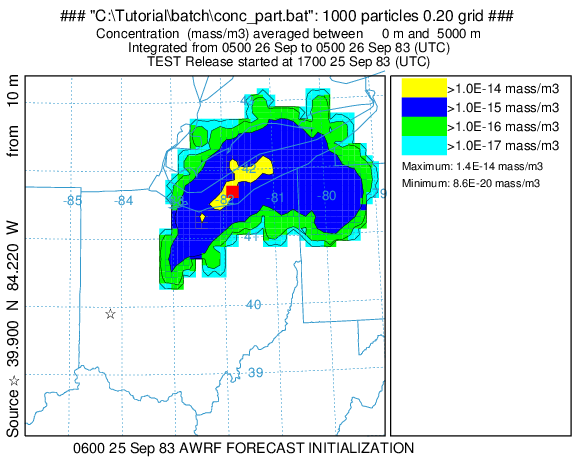
Simulation with 1000 particles
Simulation with 10000 particles
Maximum concentration differences with 0.10 grid -
- 100 to 1000 particles: 50%
- 1000 to 10000 particles: 36%
Maximum concentration differences with 0.20 grid -
- 100 to 1000 particles: 50%
- 1000 to 10000 particles: 15%
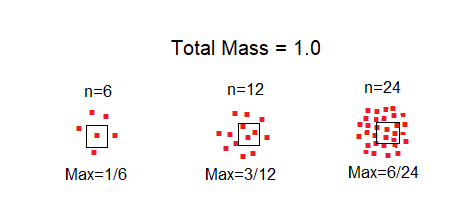
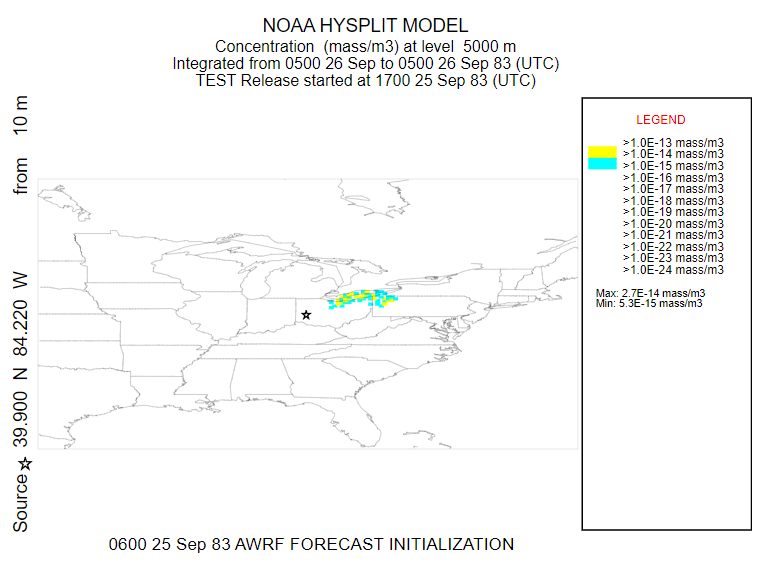
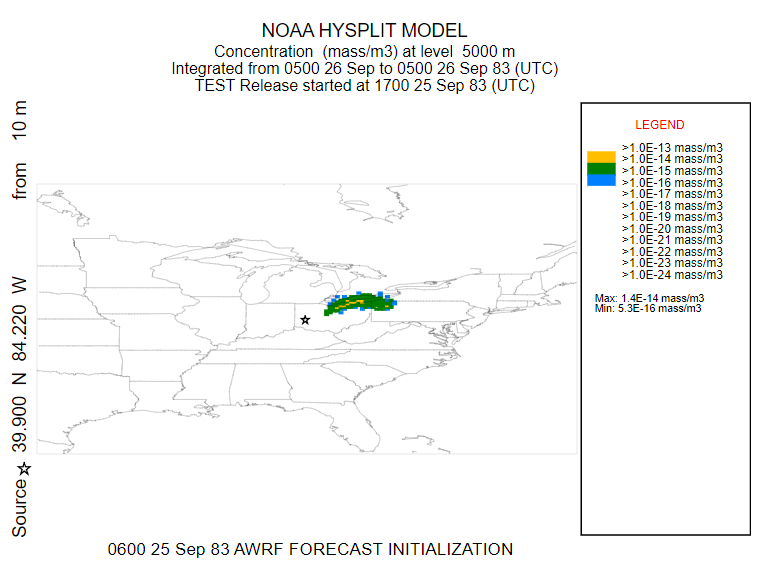
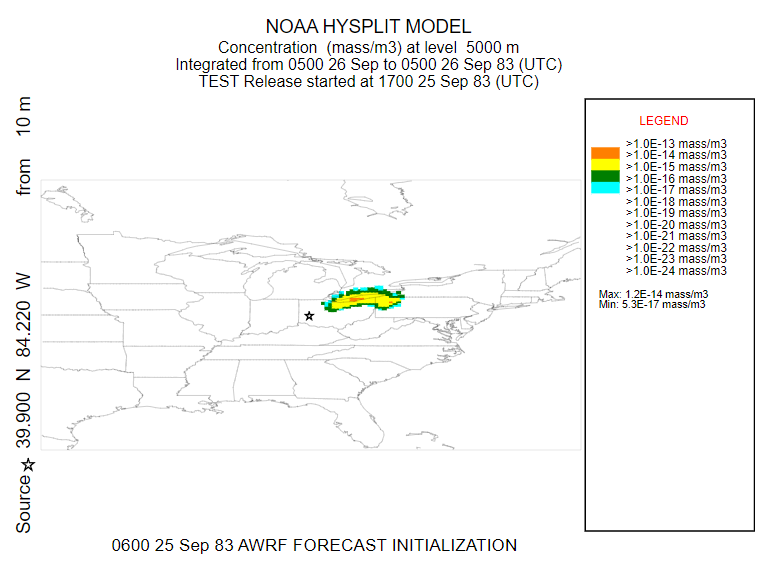
Sensitivity of Minimum Concentration to Particle Number
Edit conc_part.bat (or .sh)
for grid size 0.20 use gridplot and display plot.html
Simulation with 100 particles ... min = 5.3E-15
Simulation with 1000 particles ... min = 5.3E-16
Simulation with 10000 particles ... min = 5.3E-17
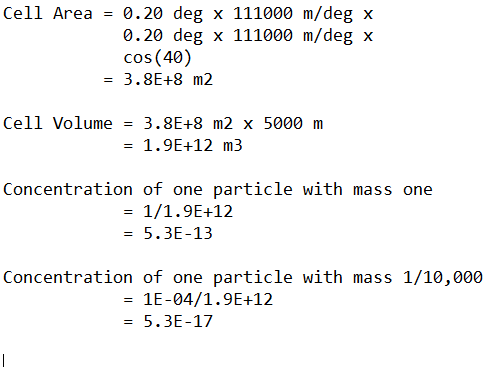
Hypothetical example