
World Meteorological Organization (WMO) Atmospheric Dispersion Model Simulations of Fukushima Daiichi AccidentProject OverviewThe Atmospheric Transport and Dispersion Model (ATDM) results from an effort organized by the World Meteorological Organization (WMO) to assist the United Nations Scientific Committee on the Effects of Atomic Radiation (UNSCEAR) in its assessment of the Fukushima Daiichi accident is presented on this page. The WMO convened a small Task Team (TT) consisting of experts from Japan, United Kingdom, Canada, Austria, and the United States to examine how the use of meteorological analyses and the introduction of additional meteorological observational data could improve atmospheric transport, dispersion and deposition calculations. The TT was assisted by individual contributors from each organization as well as the EC Joint Research Centre's ENSEMBLE project. Each member ran their organization's ATDM with the various meteorological data available and compared the model results against radiological monitoring data. There were four global meteorological analyses data sets available from various centers and two regional high-resolution analyses from the Japan Meteorological Agency (3D mesoscale analysis and radar- rain-gauge analyzed precipitation - see the READMET.TXT for required acknowledgement). Not all of the ATDMs were able to use all of the meteorological data. The ATDMs were configured identically as much as possible with respect to the release duration, release height, concentration grid size, and averaging time. However, each ATDM retained its unique treatment of wet and dry deposition, one of the largest uncertainties in these calculations. In addition to the individual model results, a subset of models represented by their ensemble mean is also available. The results are summarized in Annex III of the report of the 3rd meeting. Computational ApproachThe computational procedure is to use an Atmospheric Transport and Dispersion Model (ATDM) to compute downwind air concentrations and depositions. The ATDM simulation is divided into smaller time segments and each segment is an independent calculation using a unit source (1/hr) emission. Each calculation provides the dispersion factors from the release point for that emission period to all downwind grid locations, defining how much of the emissions are transferred to each location for every output time period. The set of calculations for all emission times is defined as the Transfer Coefficient Matrix (TCM). The TCM is computed for inert and depositing species. When quantitative results are required, the actual air concentrations and depositions are computed in a simple post-processing step by multiplying the TCM by the appropriate time-varying emission rates and radioactive decay constant for each desired radionuclide. Results for multiple emission scenarios can be created and used to optimize the model results as more measurement data become available. In this online version, the TCMs have been calculated by several different ATDMs, each using the same or different meteorological data as indicated in the selection list shown below. An initial temporal varying emission rate (Bq/hr) is provided, which may be changed by the user in the next step of the evaluation for any of the 3-hour emission periods. Emission rates are decay corrected to 0600 UTC 11 March. Decay to the sampling time is applied in the postprocessing. The user can also select one of three generic species tracked as surrogates for the radionuclides: a gas with no wet or dry scavenging (non-depositing gas), a gas with a relatively large dry deposition velocity and wet removal to represent gaseous I-131 (depositing gas), and a particle with a small deposition velocity (light particle). Not all ATDM calculations used exactly the same assumptions regarding scavenging for the radionuclide surrogates. See the individual model documentation below for a more detailed explanation:
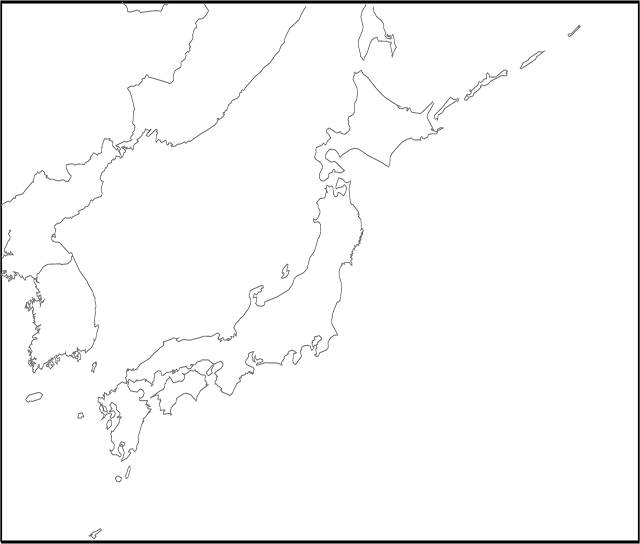
All ATDMs used a similar grid configuration of 600 (West to East) and 400 (South to North) grid cells defined on a regular latitude-longitude grid at 0.05 degrees resolution (about 5 km) centered at 38N and 140E. The TCM output is defined as 3-hour averages for air concentrations and 3-hour deposition totals. ATDM calculations were started every 3 hours from 11 March 0000 UTC through 31 March 2100 UTC, resulting in 168 independent calculations. Although there were some variations between models, most ATDMs released about 100,000 particles per hour (total mass = 1) and followed those particles for 72 hours. Extract the Air Concentration and Deposition from a selected ATDM: |
|
|
|
